3.9.3.4 - Detection of Exoplanets
An exoplanet can reveal itself through the motion and brightness of its host star. Interpret radial-velocity and transit signals, then decide what they establish about orbital period, mass, radius and density.
Why direct detection is difficult
An exoplanet is a planet outside the Solar System. Some have been directly imaged, but imaging a planet separately from its host star is difficult for two different reasons.
First, the star is much brighter than the planet, so stellar glare can overwhelm reflected planetary light. Second, their angular separation is small at large distance. The planet can lie within the star's diffraction pattern even though their physical separation is enormous by everyday standards. Ground-based atmospheric blurring makes resolution harder still.
Increasing angular resolution alone does not remove the brightness-contrast problem. Direct imaging favours suitably bright planets at larger projected separations, and often uses infrared radiation and suppression of the star's light. The two indirect techniques in this lesson instead measure changes in the star's spectrum or brightness.
The radial velocity method
A planet and its star both orbit their common centre of mass. The more massive star follows a smaller orbit. If part of its velocity lies along our line of sight, the star's identified spectral lines vary periodically in wavelength.
[DIAGRAM: asset_name: A.3.4 - Detection of Exoplanets - Diagram 1; asset_slug: A.3.4 - Detection of Exoplanets - Diagram 1; caption: Stellar motion around the common centre of mass produces a periodic Doppler shift; description: Top-down view with the observer in the orbital plane to the left. Star and planet occupy opposite sides of the common centre, with tangent velocities in opposite directions.]
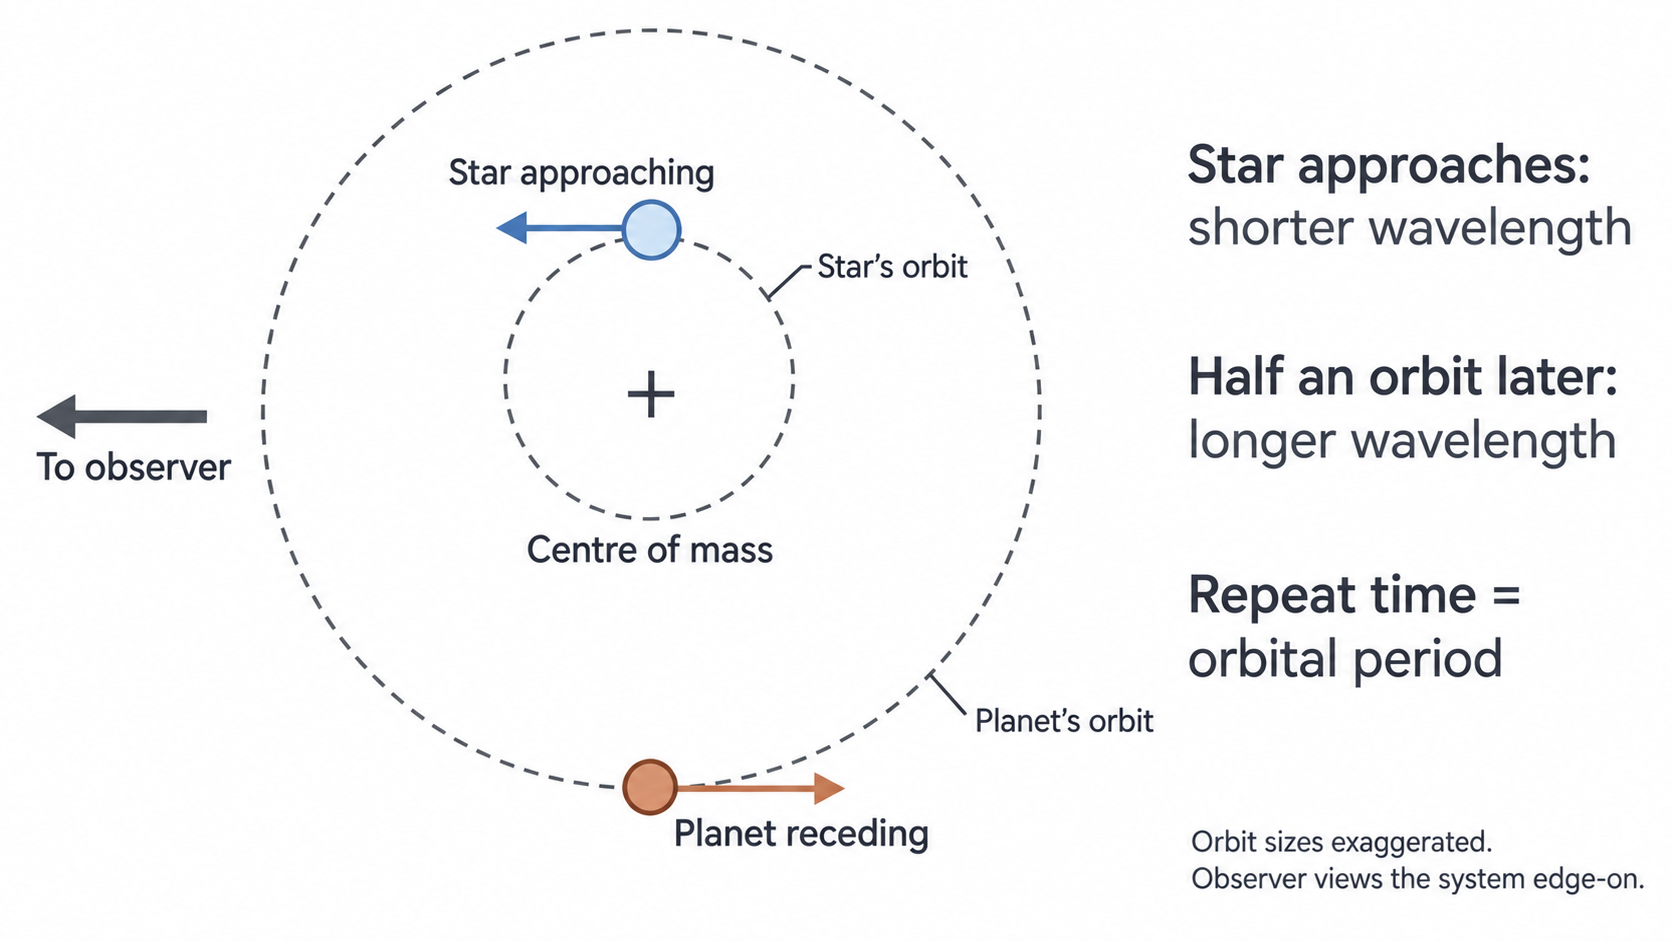
When the orbital motion is towards the observer, the stellar lines shift to shorter wavelengths; when it is away, they shift to longer wavelengths. Measure many spectra over time, compare with laboratory lines and fit the repeating radial-velocity pattern. Its repeat period is the orbital period. A one-off redshift is not this evidence: it may only measure the whole system's motion.
The curve varies about the systemic velocity of the star–planet system. A rapidly receding system may remain redshifted throughout its orbit, with the redshift alternately becoming larger and smaller. Subtract the mean shift to find the orbital amplitude.
What sets the signal size?
For otherwise comparable circular systems, a more massive planet and a smaller orbit produce a larger stellar radial-velocity amplitude. Low-mass planets can produce changes too small to separate from instrumental noise and stellar activity. A claim that detection is “difficult because the planet is small” needs this link to the measured signal.
An edge-on orbit maximises the line-of-sight motion; a face-on orbit has no orbital radial component. If inclination is unknown, the measurement generally constrains a minimum planet mass, , after using the orbital period and stellar mass. Here is edge-on. The planet may be more massive than that minimum. Amplitude alone does not determine mass without the other system information.
The transit method and light curves
A transit occurs when a planet passes between the star and observer and covers part of the visible stellar disc. A photometer records received intensity against time, producing a light curve. The dip repeats once per orbit if the planet continues to cross the disc.
During ingress, the planet begins to overlap the disc and intensity falls. During a full, non-grazing transit the covered area is nearly constant, so an ideal uniform star gives a nearly flat minimum. During egress, overlap decreases and intensity returns to the baseline. Real stars are dimmer near their apparent edges (limb darkening), and grazing transits can give rounded or V-shaped dips.
Continue this lesson.
You’re previewing NovaLearn without an account. Create a free account to read the rest.
Create free account