3.9.2.5 - The Hertzsprung–Russell Diagram
An HR diagram separates surface temperature from intrinsic brightness. Learn to read its scales, explain the main stellar groups and trace a Sun-like star’s evolution without mistaking the main sequence for a single path through time.
Reading the axes and scales
An HR diagram plots intrinsic brightness against surface temperature. Distance has already been removed by using absolute magnitude or luminosity, so it is not a map of where stars are in space.
In the absolute-magnitude form required here, the vertical scale runs approximately from at the top to at the bottom. Upwards means more luminous, although the magnitude number becomes smaller. Equal steps in magnitude represent equal luminosity ratios in the same measured band. For example, a five-magnitude upward step means 100 times the luminosity in that band.
The horizontal temperature axis runs from about 50 000 K on the left to 2500 K on the right. It is commonly logarithmic, so equal spacings represent equal ratios, not equal temperature differences. Read the printed ticks rather than estimating with a linear ruler. The spectral sequence OBAFGKM can be used instead, with O at the hot left end and M at the cool right end.
[DIAGRAM: asset_name: A.2.5 - The Hertzsprung-Russell (HR) Diagram - Diagram 1; asset_slug: A.2.5 - The Hertzsprung-Russell (HR) Diagram - Diagram 1; caption: HR axes: brighter upwards and hotter to the left; description: Equal magnitude steps vertically and a reversed logarithmic temperature axis from 50000 to 2500 K. This empty grid isolates the coordinate conventions.]
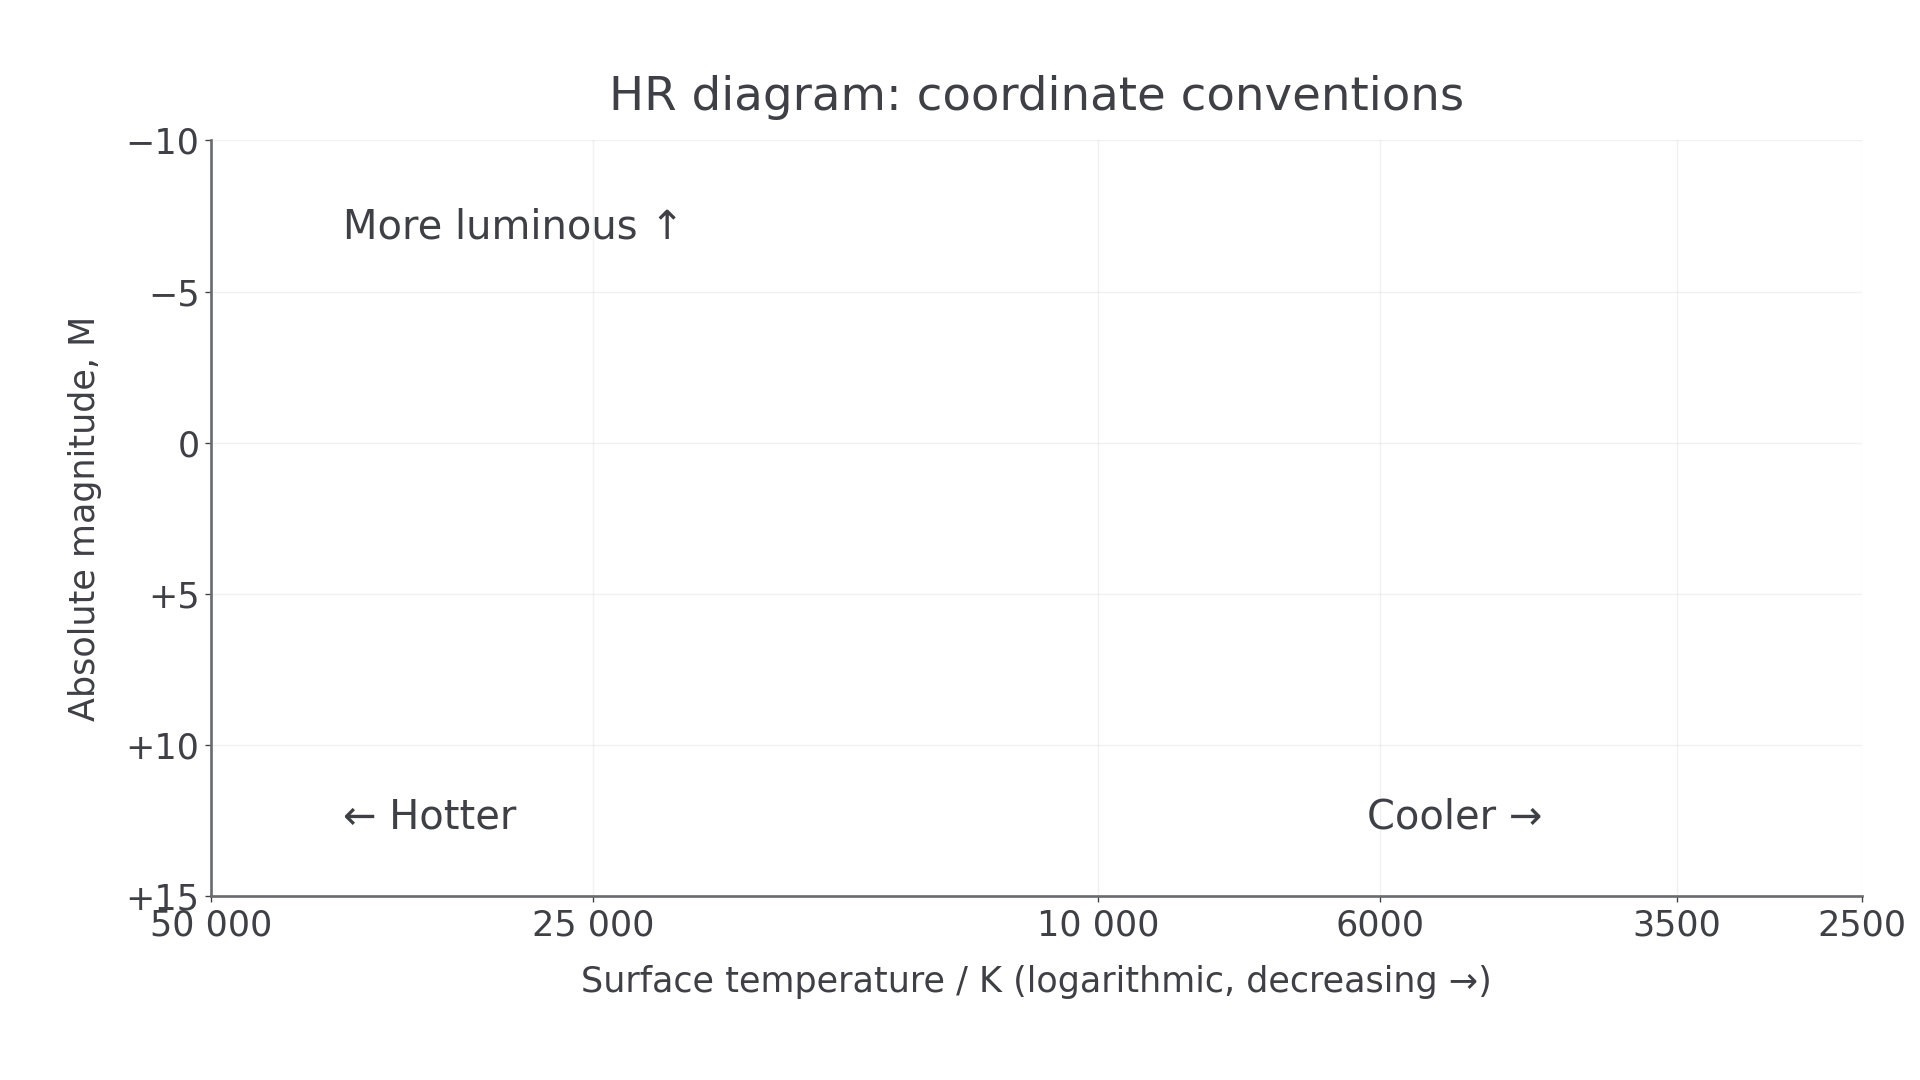
For example, is hot but faint: left and low. A star at is cool but luminous: right and high. These two coordinates, not temperature alone, determine its placement.
Main sequence, giants and white dwarfs
Main-sequence stars fuse hydrogen into helium in their cores. They occupy a broad band from the hot, luminous upper left to the cool, faint lower right. Position along that band primarily reflects different stellar masses, not successive ages of one star. The Sun does not spend its life travelling from O to M along the band.
Red giants are cool at the surface but luminous, so they lie above the main sequence towards the right. Supergiants occupy high luminosities over a wide temperature range; not all supergiants are red. White dwarfs are small stellar remnants, initially hot but faint, lying below the main sequence towards the left. As they cool they can move towards lower temperatures as well.
[DIAGRAM: asset_name: A.2.5 - The Hertzsprung-Russell (HR) Diagram - Diagram 2; asset_slug: A.2.5 - The Hertzsprung-Russell (HR) Diagram - Diagram 2; caption: The main stellar regions and the Sun on an HR diagram; description: Schematic broad regions on correctly scaled axes: diagonal main sequence, red giants above it, supergiants across high luminosities and white dwarfs below it. The Sun is marked at 5800 K and M=4.8.]
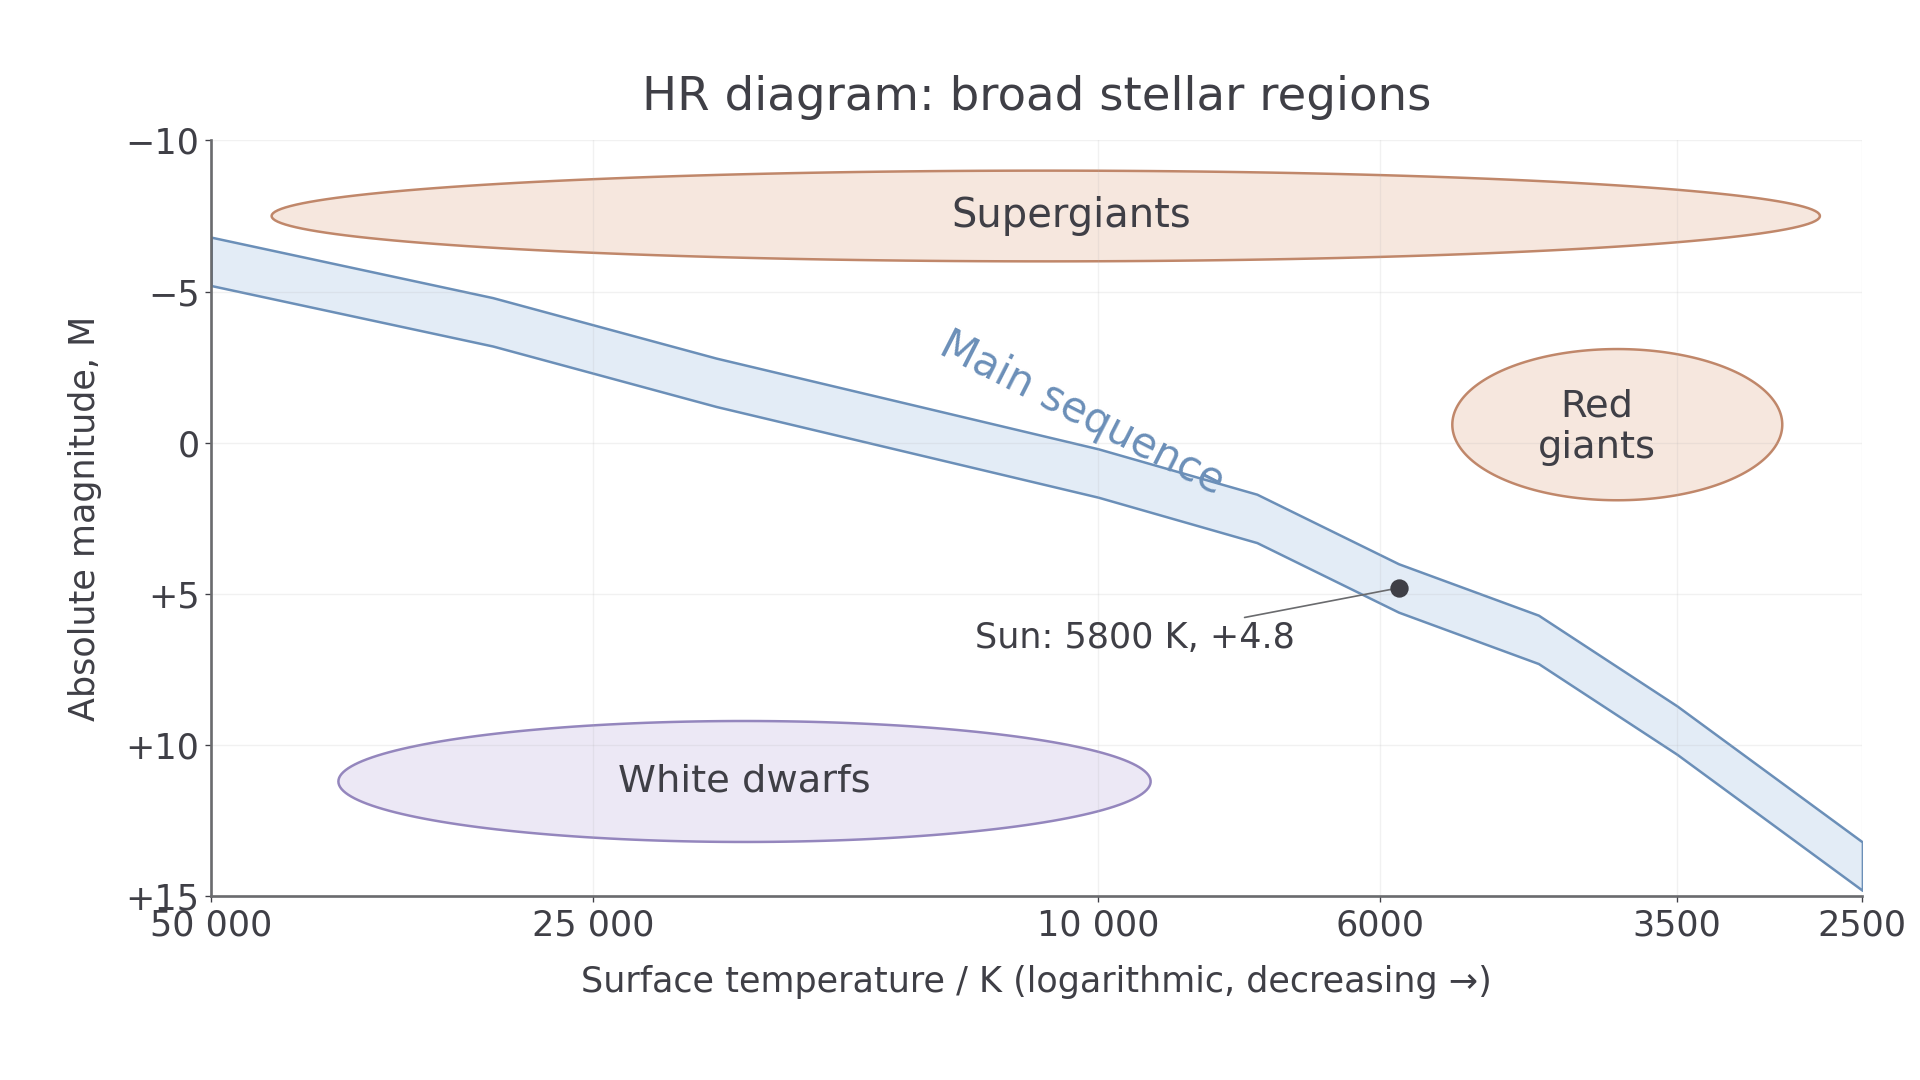
Stefan’s law explains why temperature and luminosity need not track each other. For a spherical star, . A red giant's very large radius compensates for its cooler surface. A white dwarf's very small emitting area keeps its total power low despite a hot surface. These explanations refer to total luminosity; the magnitude diagram supplies the corresponding qualitative classifications, with detailed band corrections omitted.
A single coordinate pair can suggest a class of object, but the diagram's regions are broad rather than rigid boxes. Use both temperature and intrinsic brightness when justifying a classification.
Continue this lesson.
You’re previewing NovaLearn without an account. Create a free account to read the rest.
Create free account