3.9.2.6 - Supernovae, Neutron Stars and Black Holes
Stellar explosions connect the physics of compact remnants with measurements of the expanding Universe. Distinguish core collapse from Type Ia explosions, use a light curve as distance evidence, and calculate neutron-star densities and black-hole horizon radii.
Core-collapse supernovae and gamma-ray bursts
A supernova undergoes a rapid, enormous increase in luminosity, followed by fading. Its absolute magnitude becomes much more negative during the brightening. The specification’s phrase “increase in absolute magnitude” describes the increased brilliance; do not interpret it as an increase in the numerical magnitude.
In a massive evolved star, fusion can build an iron-rich core. Further fusion of iron-group nuclei does not provide an energy source to sustain the core. As the core becomes unstable, gravity drives rapid collapse. A shock and energy transfer, including neutrino processes, can eject the outer layers. The remaining core may become a neutron star or a black hole. The outcome depends on the remnant and the mass lost; it is not set by one universal initial-mass boundary.
The energy powering the collapse is predominantly gravitational, not fusion of iron releasing more energy. Supernovae distribute material into space, but it is incorrect to claim that every heavy element is made by ordinary fusion in a supernova shock. The details of explosion mechanisms and element production are beyond this specification.
Some collapsing supergiant stars form a compact remnant and launch powerful jets that produce a gamma-ray burst, a brief flash of high-energy electromagnetic radiation. Not every supernova produces a burst directed at Earth. Other burst origins exist; here the required link is massive-star collapse to a neutron star or black hole.
Energy comparisons need the same quantity on both sides. Energy is measured in joules; luminosity is power in watts. At constant solar luminosity , the Sun radiates in years
An explosive event with a quoted energy near is therefore comparable to this lifetime estimate. Supernova total, kinetic and electromagnetic energies are different, and a burst's inferred energy can depend on beaming. Use the energy specified in a question rather than assuming one value describes every explosion.
Type Ia light curves and standard candles
A Type Ia supernova is a thermonuclear explosion involving a white dwarf, rather than the ordinary core collapse of a supergiant. One important model involves a white dwarf gaining matter from a companion towards the Chandrasekhar limit, about solar masses, until runaway nuclear reactions disrupt it. This limit concerns a white dwarf supported by electron degeneracy pressure; it is not the initial mass of every exploding star or a universal lower limit for neutron-star mass. Merging white dwarfs provide another route, so not all Type Ia explosions occur at exactly the same mass.
A standard candle has a known intrinsic luminosity or absolute magnitude. Type Ia events have broadly similar, calibratable peak luminosities. Measuring their apparent magnitude therefore gives a distance, provided absorption and the calibration are accounted for. Their great luminosity makes them visible over large intergalactic distances.
A light curve records intensity or magnitude against time. A typical Type Ia rises to maximum brightness over roughly two to three weeks, then fades more slowly. On a magnitude plot, the brightest point has the smallest magnitude. Later fading increases the numerical magnitude. A typical peak optical absolute magnitude is near , with used in the illustration; it is not an exact constant for every event.
[DIAGRAM: asset_name: A.2.6 - Supernovae, Neutron Stars and Black Holes - Diagram 1; asset_slug: A.2.6 - Supernovae, Neutron Stars and Black Holes - Diagram 1; caption: Illustrative Type Ia light curve: fast brightening and slower fading; description: Absolute magnitude plotted with more negative values at the top against days relative to maximum. The calibrated peak and decline shape are approximate, not an observed dataset.]
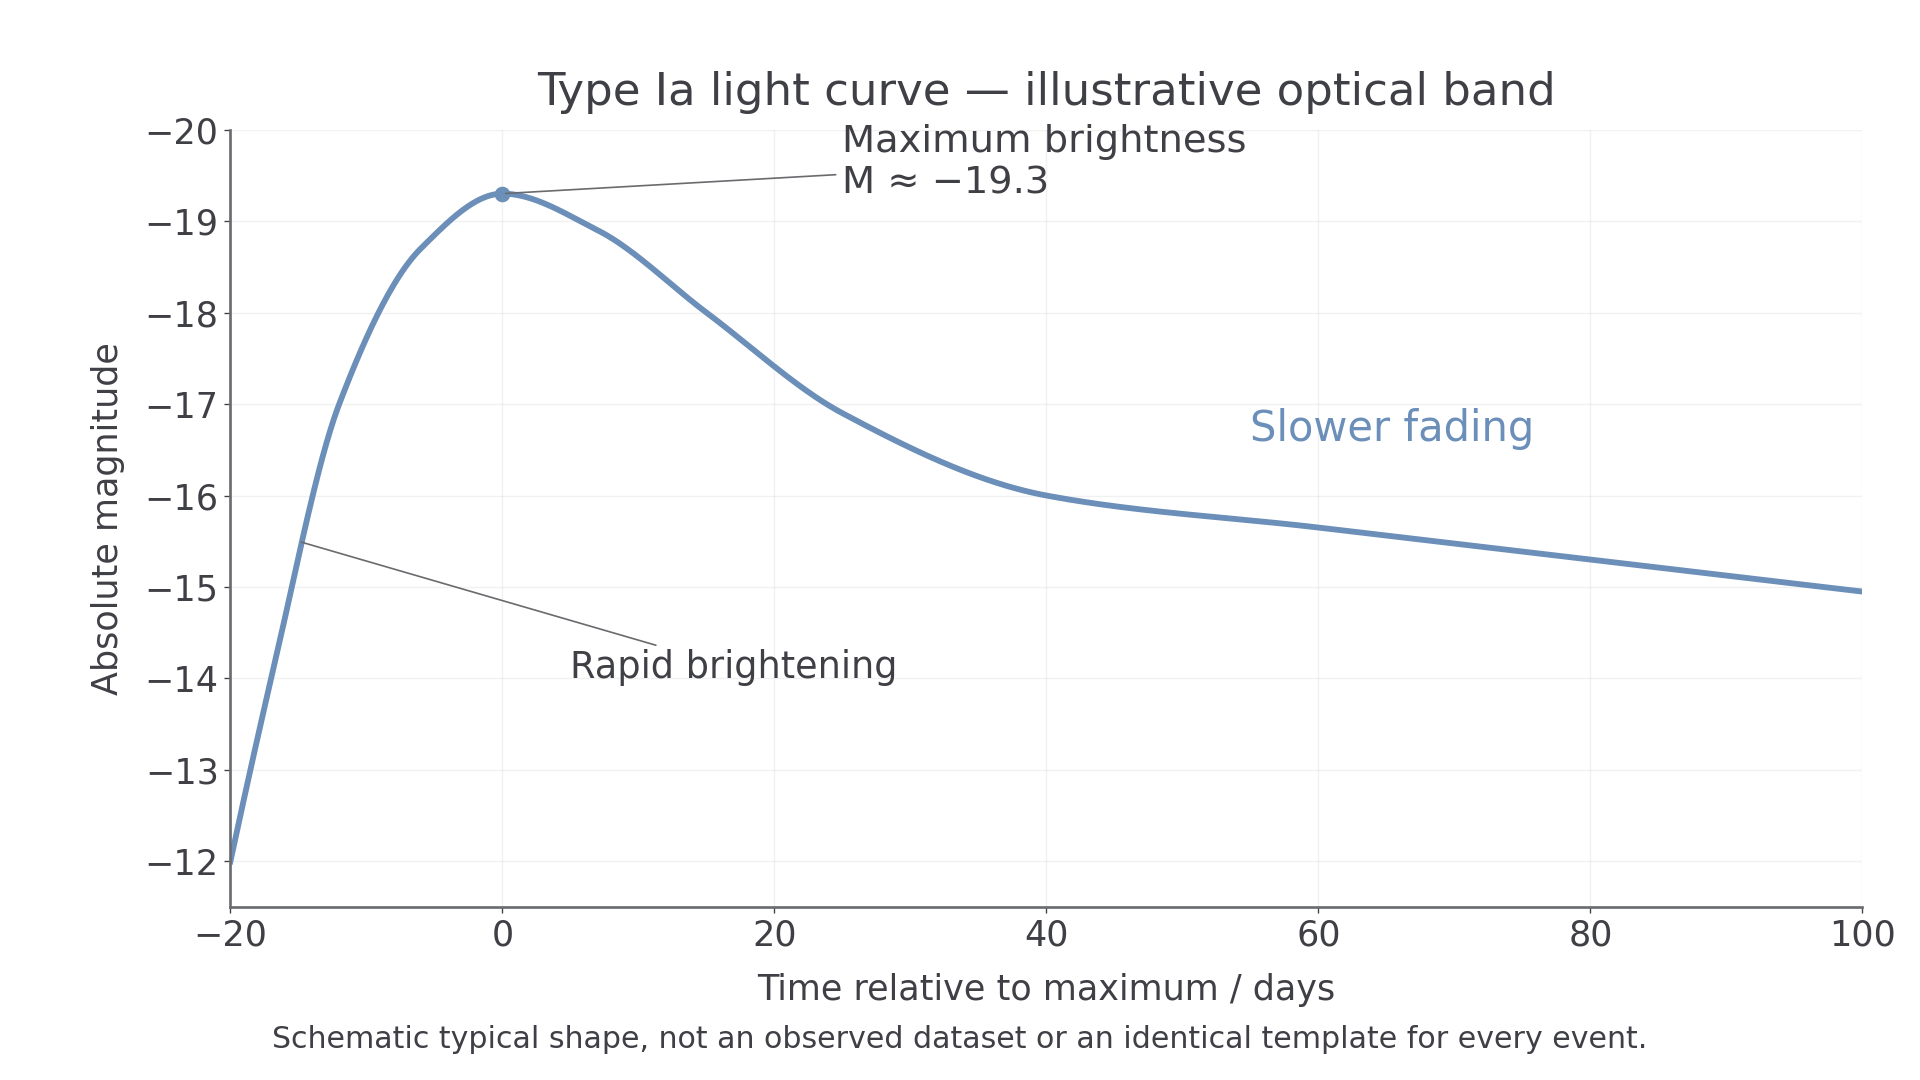
The decline shape and colour help calibrate differences between events. Radioactive decay in the ejecta supplies much of the later light, but the full magnitude curve is not a single exponential in time. Classification also uses spectra; a vaguely similar light-curve shape alone is not definitive proof of Type Ia.
For a locally calibrated event with and measured peak , . Then
This uses the magnitude-distance relation in its standard-candle form. At cosmological distances the inferred quantity is luminosity distance; interpreting it requires an expansion model rather than treating light travel as a static Euclidean journey.
Acceleration, calibration and dark energy
Distant Type Ia supernovae allow astronomers to compare a brightness-based distance with the galaxy's redshift. Redshift records the stretching of light as the Universe expands. For a given redshift, cosmological models with different expansion histories predict different luminosity distances.
Distant Type Ia supernovae were found to be fainter, and therefore farther away, than expected in then-standard decelerating models. After calibration and other checks, this distance–redshift relation supports accelerated expansion. It is not established merely by discovering that distant objects are faint or by applying the local linear Hubble relation unchanged at every distance.
Dark energy names a proposed contribution that accounts for accelerated expansion in cosmological models. Its physical nature remains unknown. Acceleration of cosmic expansion does not mean that every gravitationally bound system expands or that the Hubble parameter must increase with time; those are different statements.
The standard-candle assumption must be tested. Some Type Ia events have peak absolute magnitudes different from the expected value, including events brighter than expected. Differences in progenitors, light-curve calibration, dust or evolution with cosmic time can bias distances. For a given observed apparent magnitude, assuming an event is intrinsically brighter than it really is makes the inferred distance too large; assuming it is intrinsically fainter makes the inferred distance too small.
Continue this lesson.
You’re previewing NovaLearn without an account. Create a free account to read the rest.
Create free account