3.5.1.3 - Resistivity
Separate a material’s resistivity from the resistance of a particular wire. Use geometry and graphs to measure it, then explain the different temperature responses of metals, thermistors and superconductors.
Resistivity, length and cross-sectional area
A longer uniform wire has greater resistance; a thicker wire offers more parallel conducting paths and has less resistance. At a fixed temperature, the material property linking resistance to geometry is resistivity, .
Uniform conductor
Length is measured along the current path, and area perpendicular to it. The unit of is , since .
Resistance belongs to a specimen; resistivity belongs to its material under the stated conditions. Cutting the same wire to half its length halves its resistance without changing its resistivity. Doubling diameter quadruples area and quarters resistance. If stretching doubles length at constant volume, area halves and resistance becomes four times greater, provided resistivity does not change.
For circular wire, . Convert diameter to metres before squaring it. A wire of diameter and resistivity has
For a rectangular strip use width times thickness instead. The cross-section is not its length times width.
Measuring resistivity from a resistance graph
A resistivity measurement needs the resistance, measured length and cross-sectional area of the same piece of wire. Measure diameter with a micrometer at several positions and orientations, check its zero and use the ratchet gently. A representative mean diameter is appropriate for a reasonably uniform, circular wire; large variation means that the uniform-wire model needs reconsideration.
[DIAGRAM: asset_name: 5.1.3 - Resistivity - Diagram 1; asset_slug: 5.1.3 - Resistivity - Diagram 1; caption: Ammeter in the supply loop, voltmeter across the same two endpoints that define the test-wire length. Close the shown switch only to take readings.; description: Ammeter in the supply loop, voltmeter across the same two endpoints that define the test-wire length. Close the shown switch only to take readings.]
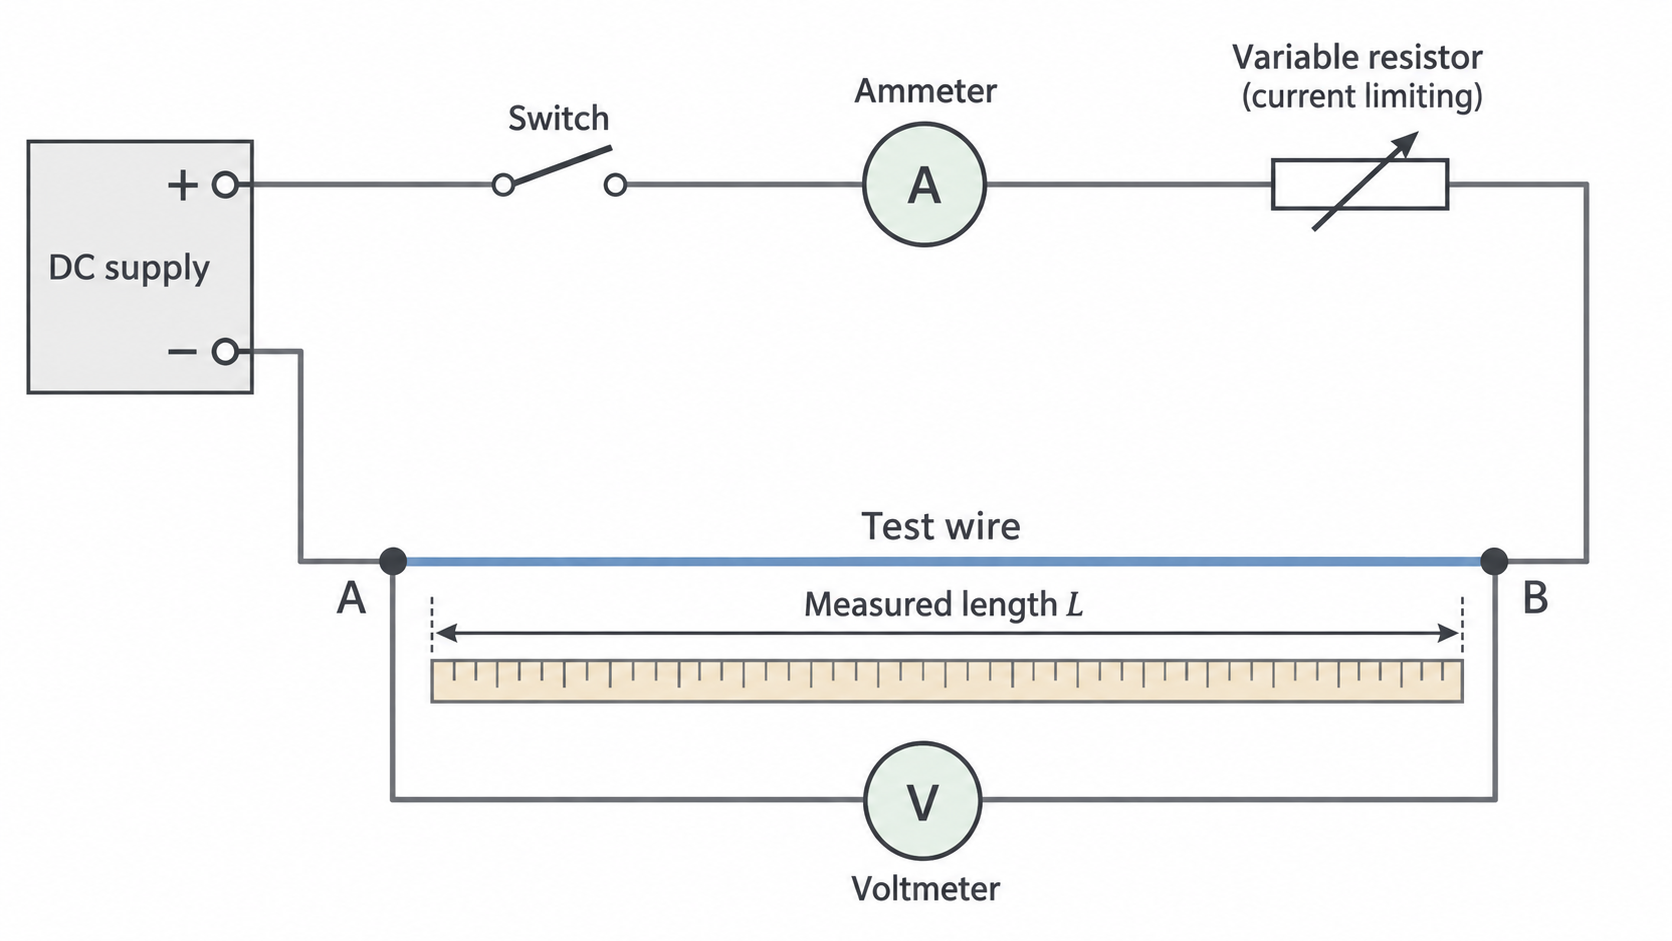
Record paired and readings for several measured lengths and calculate each . Keep current low and disconnect between readings to limit heating. Plot vertically against horizontally:
where is the gradient in .
[DIAGRAM: asset_name: 5.1.3 - Resistivity - Diagram 2; asset_slug: 5.1.3 - Resistivity - Diagram 2; caption: Ideal resistance–length relationship at constant area and temperature, with a gradient triangle on the line.; description: Ideal resistance–length relationship at constant area and temperature, with a gradient triangle on the line.]
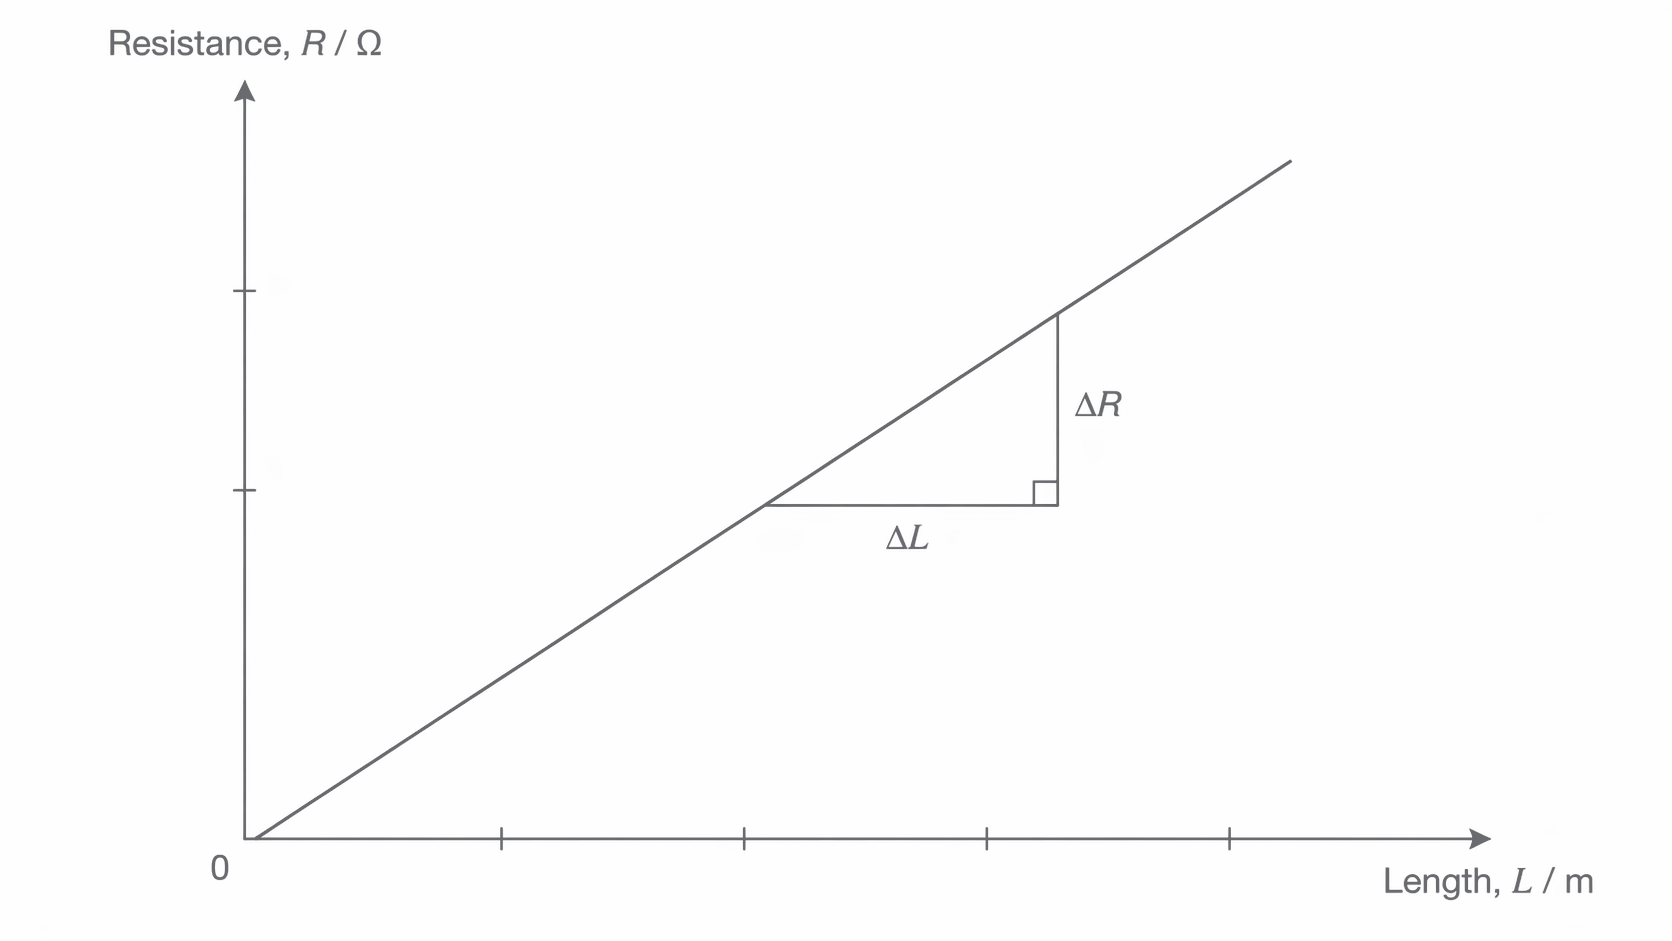
A best-fit line uses the whole trend; take widely separated points on that line for its gradient. Investigate and repeat a suspect reading instead of deleting it just for disagreeing. Do not force the fit through the origin when data support a nonzero intercept. If a constant extra resistance is included between the voltage-sensing points, : it shifts the intercept but not the gradient. Leads outside those sensing points do not directly add to the measured pd.
For example, and give . RP05 develops the method and uncertainty analysis.
Temperature changes metals and NTC thermistors differently
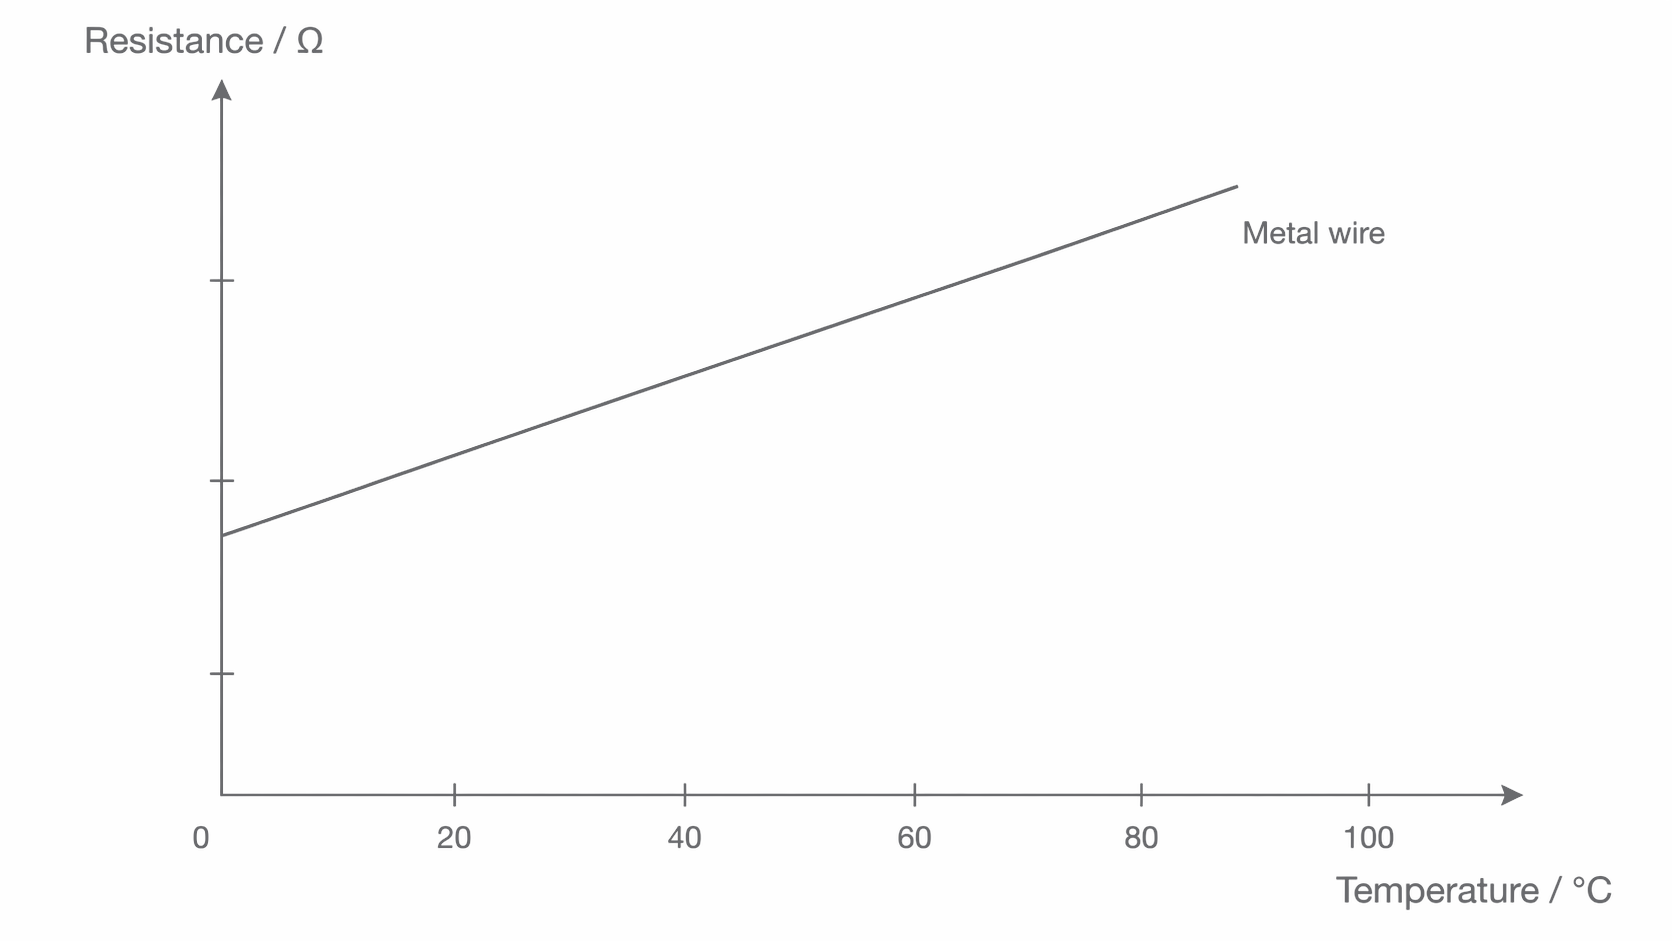
Heating a metal makes its lattice ions vibrate more strongly. Conduction electrons are scattered more frequently, so the current is smaller for the same applied pd and resistance rises. Over a moderate temperature range, a metal’s resistance often rises approximately linearly.
[DIAGRAM: asset_name: 5.1.3 - Resistivity - Diagram 3; asset_slug: 5.1.3 - Resistivity - Diagram 3; caption: Qualitative metal-wire resistance–temperature trend over a moderate range. The resistance values are not numerically scaled.; description: Qualitative metal-wire resistance–temperature trend over a moderate range. The resistance values are not numerically scaled.]
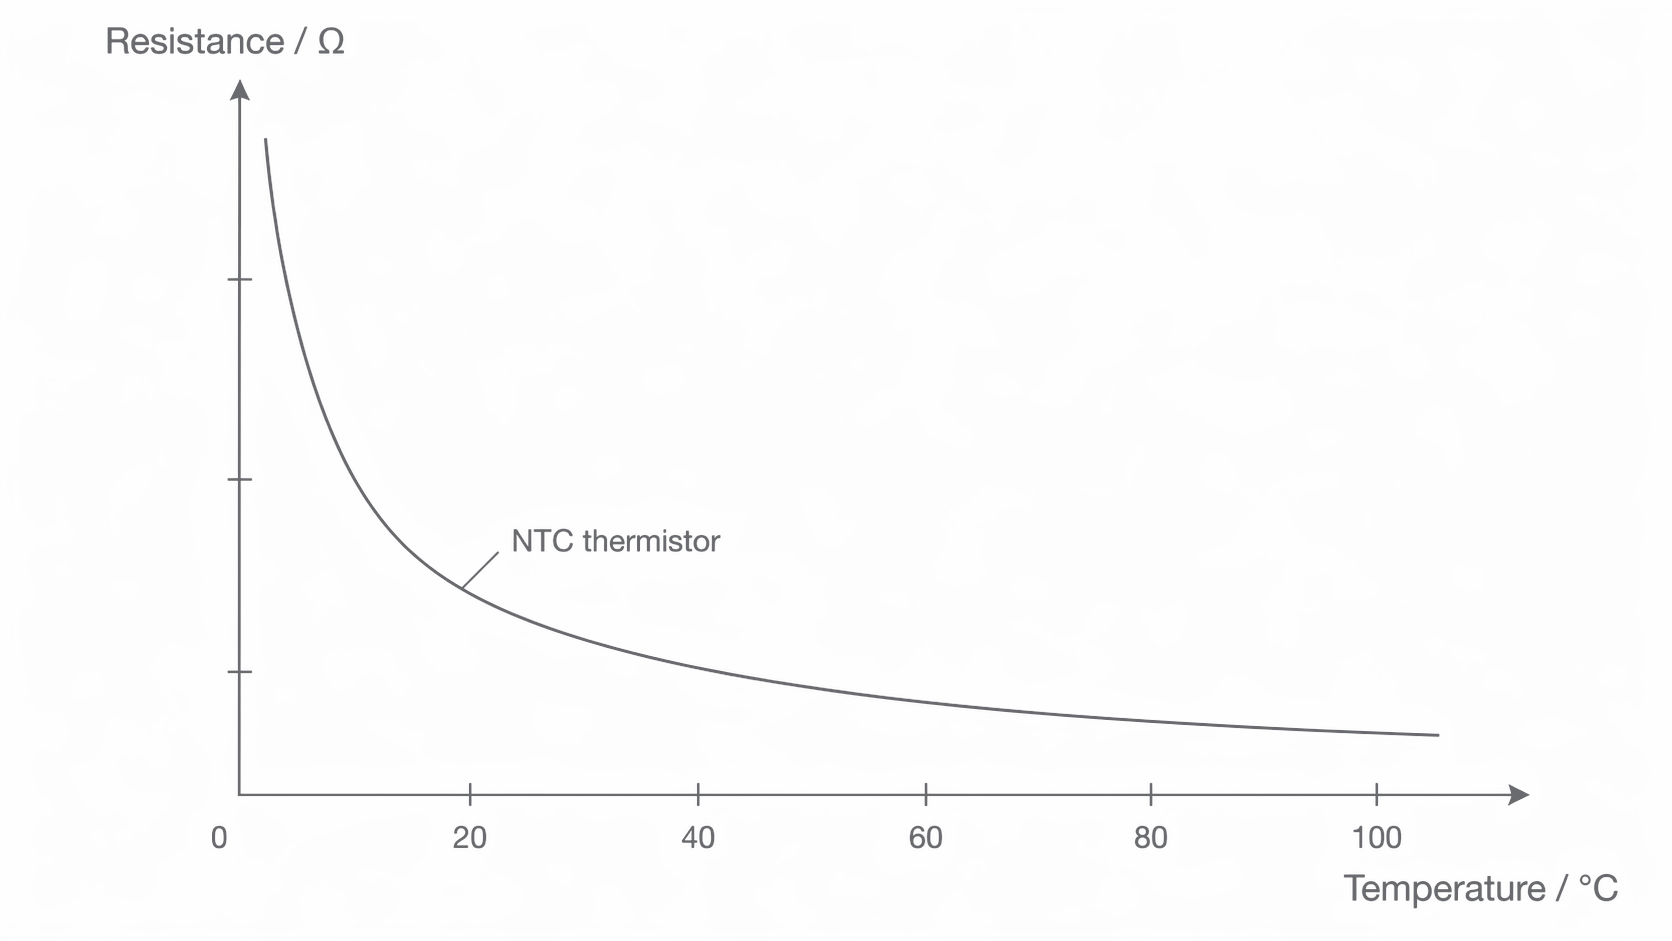
A negative temperature coefficient (NTC) thermistor behaves differently: its resistance decreases as temperature increases. Heating its semiconductor makes more mobile charge carriers available; this effect dominates the increased scattering. Its resistance–temperature curve is nonlinear, falling more steeply at lower temperatures and flattening at higher temperatures over the illustrated range. Only NTC thermistors are required here.
[DIAGRAM: asset_name: 5.1.3 - Resistivity - Diagram 4; asset_slug: 5.1.3 - Resistivity - Diagram 4; caption: Qualitative NTC thermistor resistance falls as temperature rises. The nonlinear curve can be calibrated for temperature sensing.; description: Qualitative NTC thermistor resistance falls as temperature rises. The nonlinear curve can be calibrated for temperature sensing.]
Calibrating a temperature sensor
Place a suitably waterproofed thermistor and thermometer close together in a stirred water bath. Use a low measuring current, allow both readings to settle at each temperature, then measure resistance directly or from . Record several temperatures and repeat during cooling to check lag. Plot resistance against temperature; interpolate on the calibration curve to infer an unknown temperature. A potential divider can convert this resistance change into a voltage signal.
The thermistor must measure the bath, not mainly its own electrical heating. Excessive current heats it, decreases its resistance and changes the inferred temperature. A steep part of the calibration curve gives a larger resistance change for a given small temperature change, but a nonlinear curve does not have one constant sensitivity.
Superconductivity and its uses
Certain materials have zero resistivity at and below a material-dependent critical temperature, . This is superconductivity. It is a transition to zero resistance, not just the gradual reduction in resistance of an ordinary cooled metal.
[DIAGRAM: asset_name: 5.1.3 - Resistivity - Diagram 5; asset_slug: 5.1.3 - Resistivity - Diagram 5; caption: Below and at the critical temperature the idealised superconducting resistivity is zero. Above it the material has nonzero resistivity.; description: Below and at the critical temperature the idealised superconducting resistivity is zero. Above it the material has nonzero resistivity.]
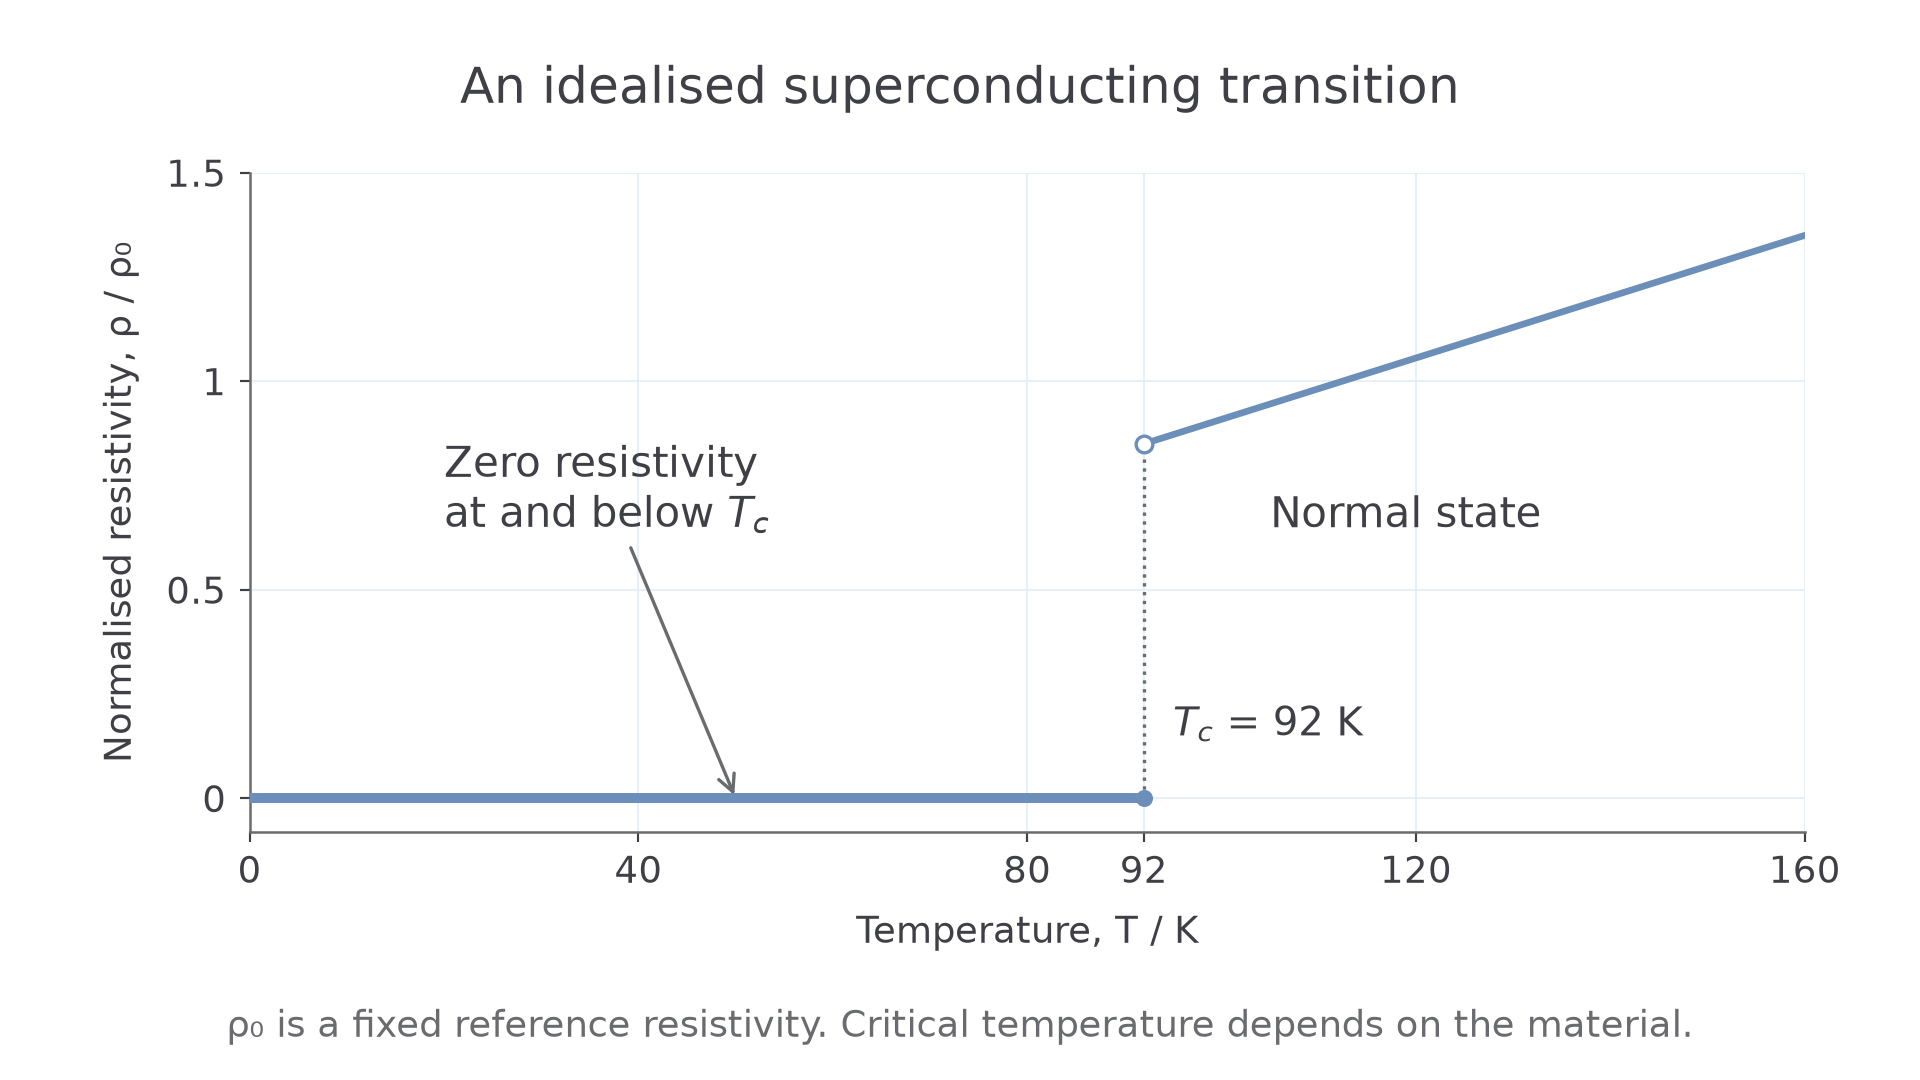
For a steady current in an ideal superconducting conductor, , so resistive heating is zero. This does not mean the entire installation requires no energy: refrigeration and other equipment still do. Nor should be used to argue that a superconductor cannot carry current when its resistive pd is zero.
Superconducting coils can maintain large currents with no resistive heating in the winding, producing strong magnetic fields, for example in MRI scanners and accelerator magnets. Superconducting power cables can reduce resistive energy losses in transmission. These advantages must be weighed against cooling requirements and engineering constraints. Critical field is outside the assessed scope of this section.
A material with is superconducting at , but not at . Its critical temperature is a material property; it is not a temperature to calculate from the resistance of an arbitrary wire.