3.4.1.7 - Work, Energy and Power
Work measures energy transferred by a force; power measures the rate of that transfer. Resolve forces along displacement, use signed graph areas for variable forces, distinguish instantaneous from average power, and measure a motor’s efficiency with realistic uncertainties.
Work and the force component
Work is energy transferred by a force acting through a displacement. For a constant force and straight displacement,
where is the angle between force and displacement. The parallel component does the work. Work is a scalar, measured in joules: . A force perpendicular to motion does zero work; a force opposing motion does negative work on the moving object.
[DIAGRAM: asset_name: 4.1.7 - Work, Energy and Power - Diagram 1; asset_slug: 4.1.7 - Work, Energy and Power - Diagram 1; caption: Only the force component along displacement contributes to work; description: Only the force component along displacement contributes to work.]
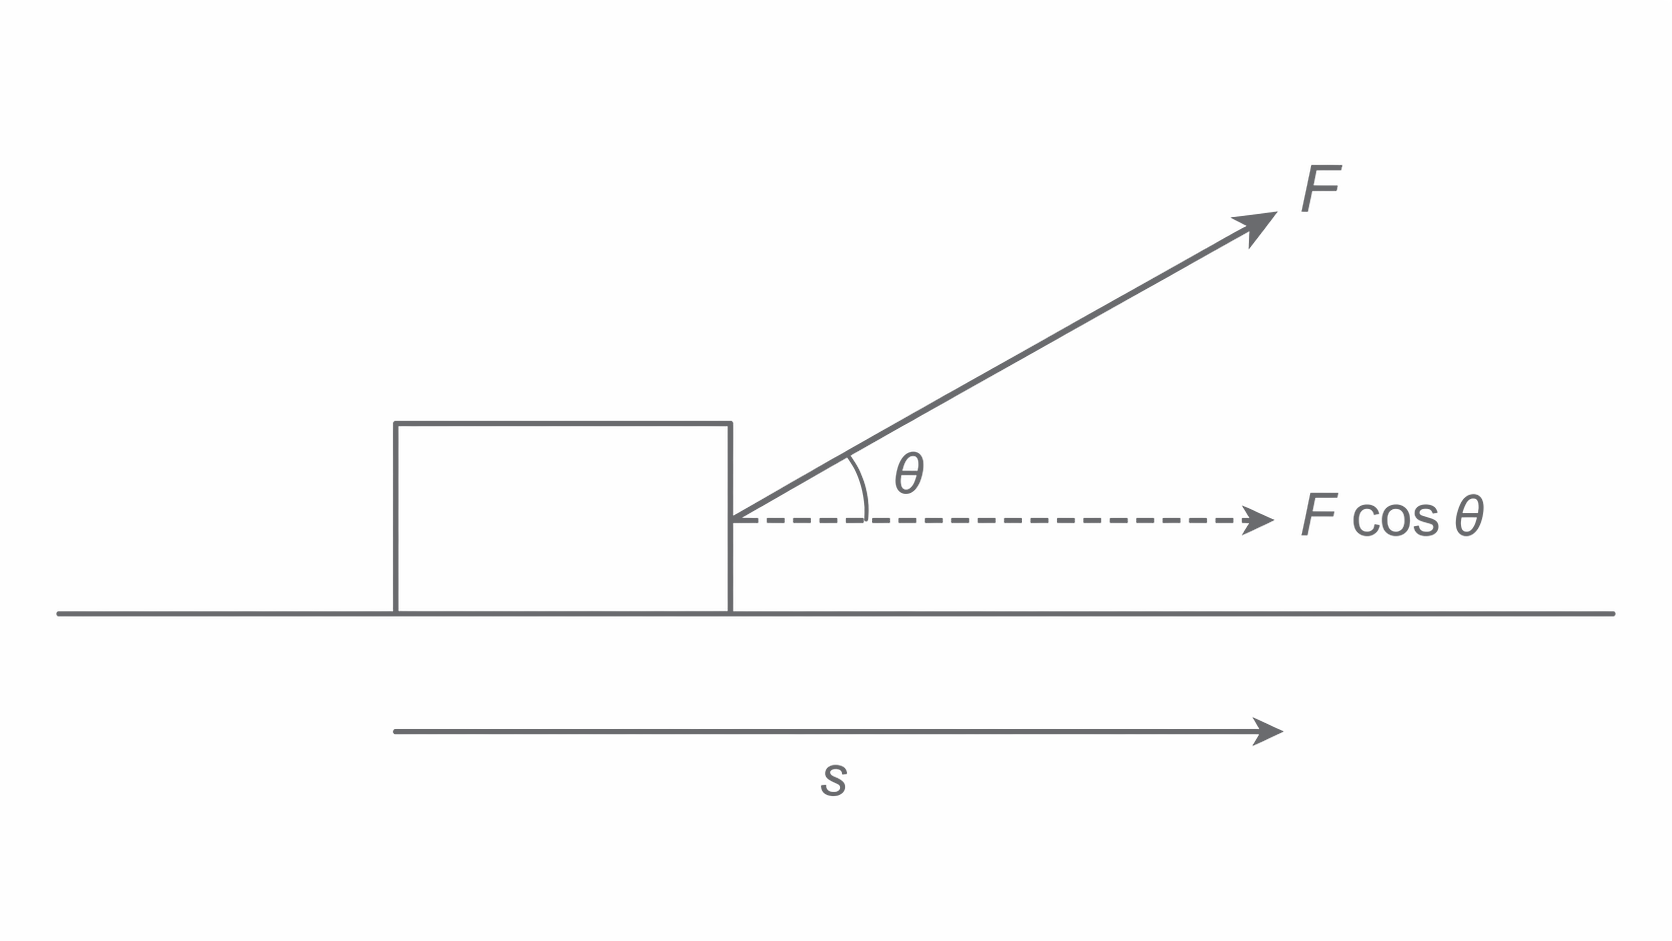
A box is pulled horizontally by at above horizontal. The pulling force does . If a friction force opposes motion, its work on the box is ; the work done against friction is the positive transferred energy . Weight and the normal force do no work during this horizontal displacement. Net work is , which is the gain in kinetic energy of the box in this model.
A person holding a bag while walking horizontally exerts an upward support force. That force does no mechanical work on the bag if its height stays constant, although the person's body still uses chemical energy. Likewise, ideal tension in a fixed-length pendulum does no work because it is perpendicular to the bob's instantaneous motion. “The object moves” alone is not evidence that every force does positive work.
Work from force–displacement area
A changing force cannot be treated as its final value acting through the whole displacement. Divide the path into short displacements over which the parallel force is nearly constant. Each contribution is , so the signed area under a parallel force–displacement graph gives work.
[DIAGRAM: asset_name: 4.1.7 - Work, Energy and Power - Diagram 2; asset_slug: 4.1.7 - Work, Energy and Power - Diagram 2; caption: Rectangular and triangular force–displacement areas represent work; description: Rectangular and triangular force–displacement areas represent work.]
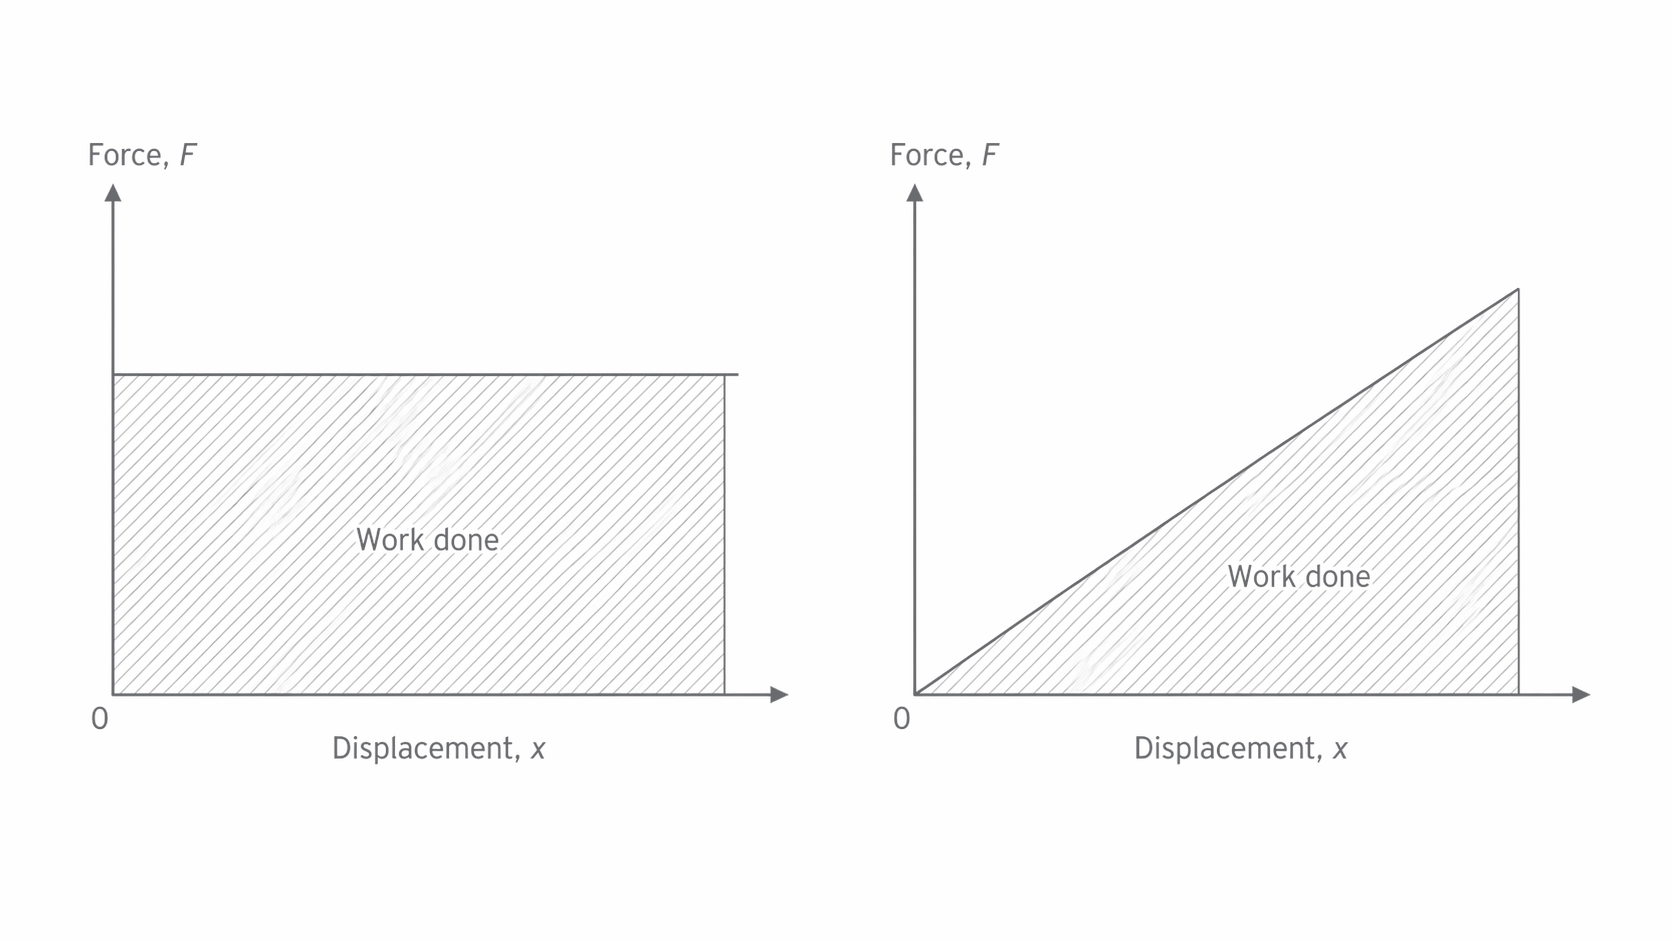
The qualitative graphs compare a constant parallel force with one rising linearly from zero. For the same endpoint force and displacement , their areas are and . Thus a spring pulled slowly from zero extension to , with pulling force rising linearly to , requires , not . The area is energy stored only when the deformation is elastic and other transfers are negligible.
A force rising linearly from to over gives a trapezium: . The arithmetic mean of endpoint forces works here because the change is linear. It is not generally the correct average for a curved graph.
For a curve, sum narrow trapezia or count calibrated squares. State each square's energy using both axis scales. For sections below the displacement axis, subtract the magnitude of the area. On an angled-force graph, use the component along displacement, not the unqualified force magnitude. A force–time graph instead gives impulse, so always read the horizontal axis before choosing the physics.
Average and instantaneous power
Power is the rate of doing work or transferring energy. Average power over an interval is . One watt is one joule per second. The same energy transferred in half the time needs twice the average power.
Over a short interval a body moves . Substituting into work per time gives the instantaneous mechanical power of a force:
For a force parallel to velocity, this reduces to . Constant speed is not required: use force and velocity at the same instant. If both vary, average power is not generally average force multiplied by average speed. Nor is mechanical power at the load necessarily the motor's electrical input power.
A vehicle moving at has driving force and resistance . The driving force supplies , resistance transfers out of mechanical energy, and kinetic energy increases at . At steady speed the driving and resistive forces balance, but the engine still supplies power to overcome resistance.
With fixed available driving power, falls as speed rises. Drag often rises with speed; the greatest steady speed is reached when available driving force equals total resistance. If a task specifies on a level road, steady motion requires . That drag law is a supplied model, not a universal law for every speed or fluid. The expression at does not predict infinite real starting force: constant-power operation ceases to describe the motor at rest.
Efficiency and a motor experiment
Efficiency is the fraction of the input transferred to the intended useful output. Compare energies over the same process, or powers at the same operating condition:
It has no unit because the numerator and denominator have the same unit. Multiply the ratio by to express a percentage. For a passive conversion device, a result above 100% signals a wrong boundary, measurement or calculation. Dissipation does not destroy energy: it makes part of the transfer unavailable for the intended task.
[DIAGRAM: asset_name: 4.1.7 - Work, Energy and Power - Diagram 3; asset_slug: 4.1.7 - Work, Energy and Power - Diagram 3; caption: A motor transfers electrical input to mechanical output and dissipated energy; description: A motor transfers electrical input to mechanical output and dissipated energy.]
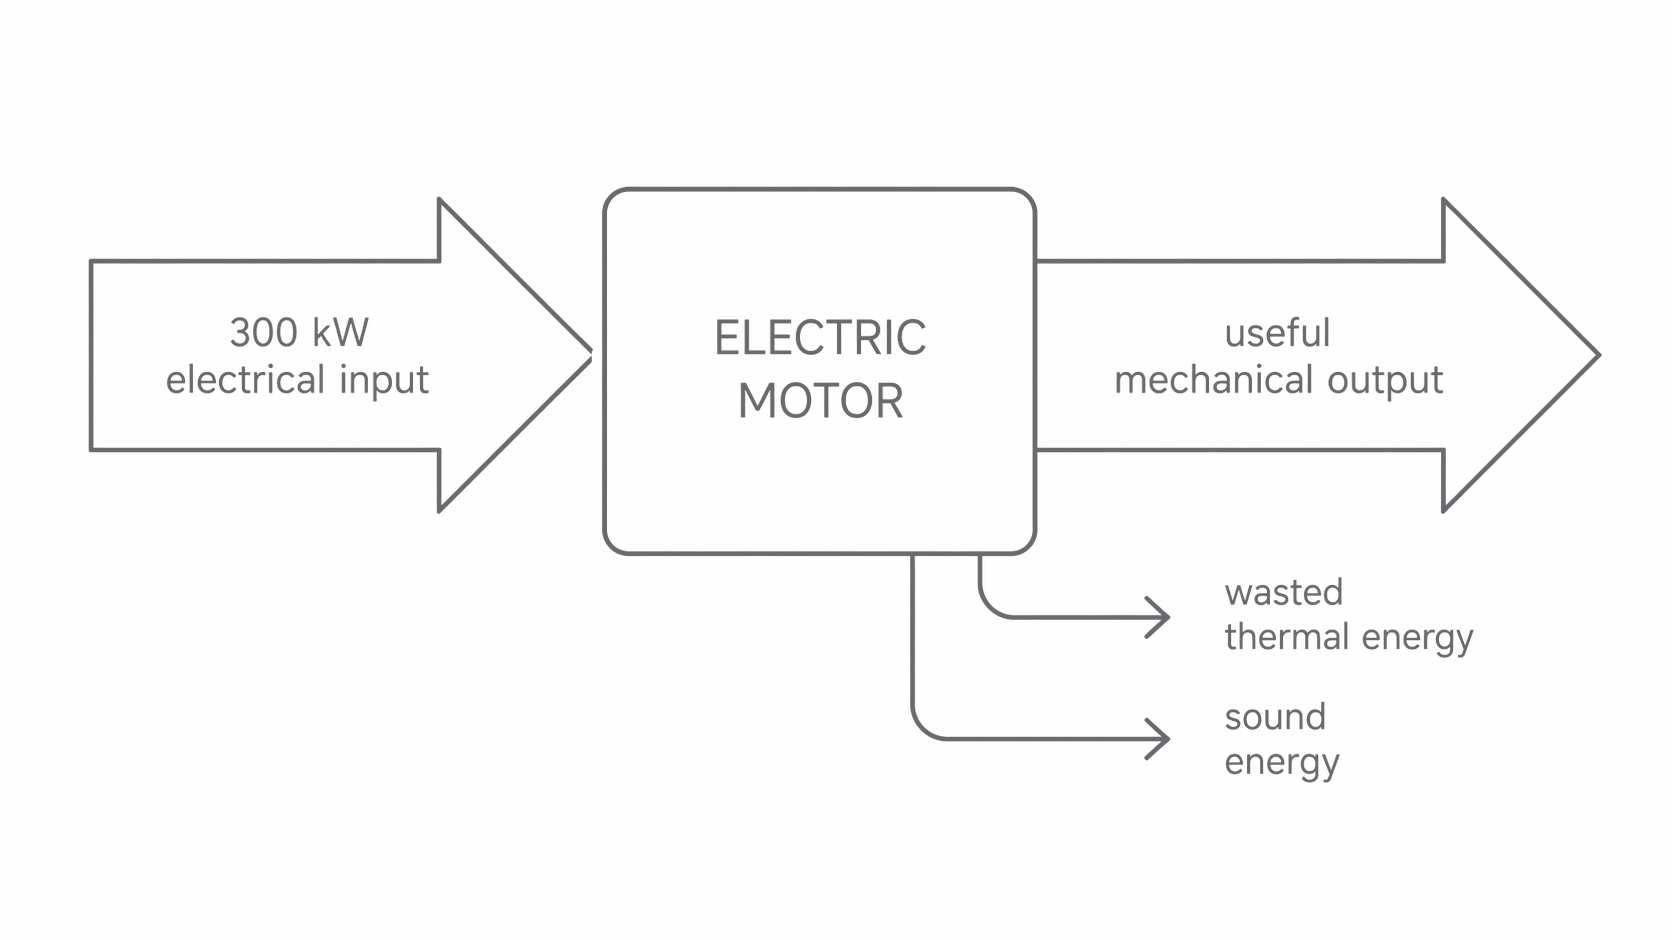
This is a schematic flow diagram, not a Sankey diagram: arrow widths are not a scale of power. With input and useful mechanical output, , or , and the remaining is dissipated. “Useful” is defined at the motor output here, even when that mechanical power ultimately heats the surroundings by overcoming a vehicle's resistance.
Measuring lifting efficiency
A low-voltage motor winds a cord to raise a known mass through a measured vertical height . Measure voltage across the motor and current through it over the same timed interval . For approximately constant and , electrical input energy is ; if they vary significantly, sample power and find its time-area. Useful output is the gravitational potential-energy gain , so . Choose an interval with the same load speed at each end, preferably steady speed, so an unaccounted kinetic-energy change does not confuse comparison with mechanical output.
For , , , and , useful energy is , input energy , and efficiency . Secure the motor and mass, use a catch tray and keep hands/hair clear of the spool. Height is the load's vertical rise, not the length wound round a changing spool radius.
Repeat trials to estimate timing scatter and avoid heating the motor progressively across the comparison. A longer safe measured rise reduces fractional height and timing uncertainties; video or light gates can reduce reaction-time error. Read a fixed marker without parallax. Check meter zeros/calibration: repeating measurements will not remove a systematic voltage error. Use range/manufacturer uncertainty and observed fluctuations, not display resolution alone.
For independent stated maximum uncertainties in a product/quotient, estimate fractional uncertainty by adding contributions. If have percentage uncertainties , the efficiency uncertainty is approximately of the efficiency, so has an absolute uncertainty of about percentage points, not 9 percentage points. This estimate ignores uncertainty in the supplied .