FS2 5.2, 5.3 - Confidence intervals for a normal mean
A confidence interval turns a sample mean into a range of plausible population means. You will interpret confidence correctly, calculate intervals when the population variance is known, recover information from an interval, plan a sample size and connect an interval with a two-sided hypothesis test.
The interval varies from sample to sample
How can the same data give a wider interval when you ask for greater confidence? An interval that catches the unknown mean more often must allow more room for sampling error. Confidence and precision compete.
A useful surprise is that halving an interval's width, while keeping confidence and population spread fixed, requires four times as many independent observations. You will calculate that square-root effect rather than just quote it.
You already know
For an independent sample from , the sample mean is exactly , with standard error . Here is the known population variance.
Imagine repeating the entire sampling procedure. Each new sample gives a new mean, so its confidence limits move. The population mean stays fixed.
Confidence interval and confidence level
A confidence interval is produced by a sampling rule designed to contain a population parameter at a stated long-run rate. A confidence procedure contains the fixed true parameter in of repeated random samples, under its assumptions.
Once one sample has been observed, its interval is fixed and either contains or does not. The refers to the procedure's repeated-sampling performance. It does not mean that of the population's individual observations lie in the interval.
[DIAGRAM: asset_name: Repeated confidence intervals and a fixed population mean; asset_slug: 9fm0-fs2-129-confidence-coverage; caption: The intervals move between samples while the true population mean remains fixed; description: Twelve horizontal confidence intervals of equal width are plotted against a measurement axis. A fixed vertical grey line marks the true mean fifty-two. Ten intervals crossing this line have pale sage backing and two that miss have pale clay backing. Grey point markers show the different sample means, and grey end caps show each interval. The legend identifies covering and missing intervals. A footer states that one run need not have exactly ninety-five percent coverage because confidence is a repeated-sampling property.]
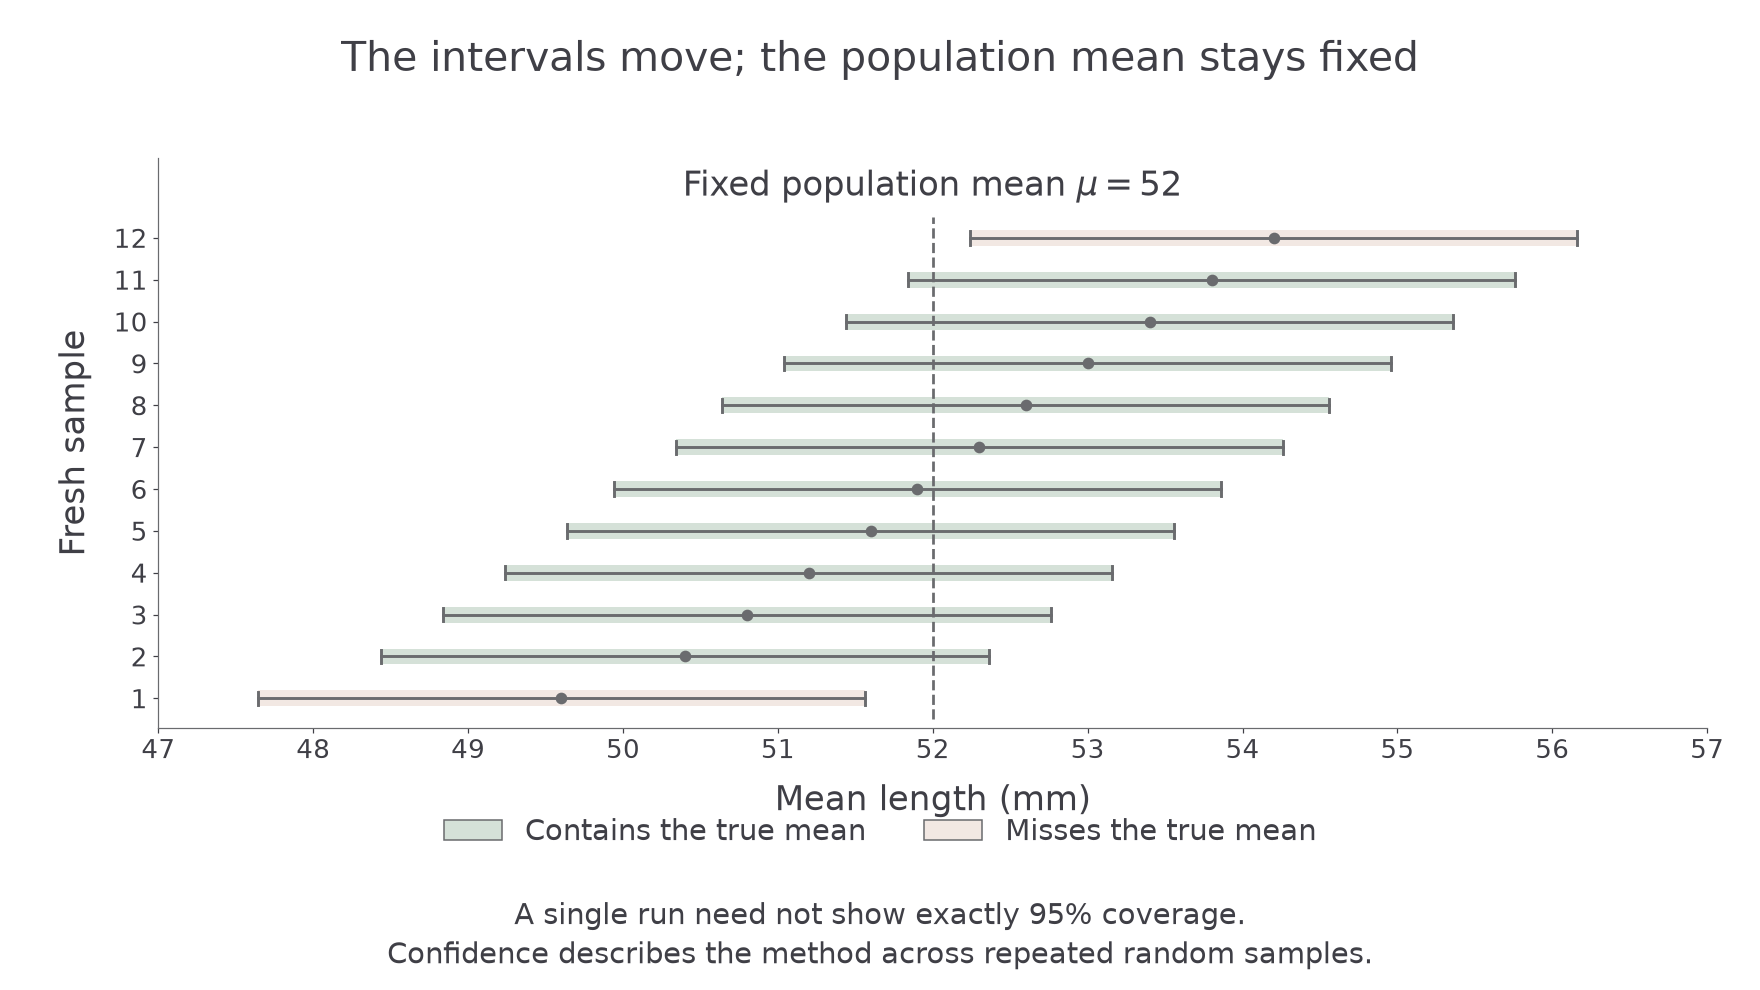
A particular run of twelve or twenty samples need not achieve exactly the nominal percentage. The confidence level is a long-run property, rather than a quota imposed on each small collection of samples.
Key idea
Confidence belongs to the random interval rule before sampling. After sampling, report its realised limits without treating the fixed population mean as a newly random observation.
Keep that meaning separate from a prediction for one future measurement.
Use the correct central normal probability
For a two-sided interval, split the excluded probability equally between the two tails. A interval excludes in each tail, rather than .
The booklet's normal percentage-point table defines by . It gives , and . Quote tabulated values in full.
Confidence limits for a normal mean with known variance
For an independent sample from , with known , a central confidence interval is
It is commonly reported as , or as its pair of endpoints. The standardised normal-mean distribution and normal percentage points are supplied; these limits follow by rearranging them and are not separately printed as an interval formula.
Not in the formula booklet: learn it.
This interval is exact under the stated normal and known-variance model, apart from numerical rounding. Replacing an unknown population standard deviation by a small-sample estimate does not preserve that exact claim; the present method uses a genuinely known .
Worked example 1: a ninety-five percent interval
Question. An independent sample of component lengths comes from a normal population with known standard deviation . Its mean is . Find a confidence interval for the population mean.
Plan. Find the standard error, use the two-tail critical value, then add and subtract the margin.
Why use ? Each excluded tail has probability .
Answer. The confidence interval is .
Check. The midpoint is , and the two endpoints are equally distant from the sample mean. The interval estimates the population mean, not individual component lengths.
Worked example 2 changes only the confidence level, from to .
Worked example 2: greater confidence
Question. For the same sample and known population standard deviation, find a confidence interval for the mean length.
Plan. Keep the centre and standard error, replacing the critical value by the one for tail probability .
Why does the interval widen? It must cover more of the sample mean's possible errors while using the same data.
Answer. The interval is , or approximately .
Check. , so the interval contains the interval, answering the opening question.
Use enough figures in the limits to make the intended accuracy clear; keep the full critical value until the final calculation.
Watch out
Wrong: use for a central interval, or use as standard error. Right: split the tails and use .
Change only the confidence level again.
Read the centre and half-width backwards
A symmetric normal interval records two pieces of information: its midpoint is the observed sample mean, and its half-width is the critical value times the standard error. The midpoint is not proof that the population mean equals that number.
For endpoints and , let . Rearranging gives
These are derived rearrangements, not separately printed booklet formulas. If the question asks for a variance, square the recovered standard deviation.
Worked example 3: recover the variance used
Question. A interval formed using a known population variance and is . Find the sample mean and population variance used in the calculation.
Plan. Recover the midpoint and half-width, then solve the margin equation for .
Why halve the width? The margin extends from the sample mean to one endpoint, rather than from one endpoint to the other.
Answer. The sample mean was , and the known population variance was .
Check. Substituting them gives , exactly the stated interval.
Continue this lesson.
You’re previewing NovaLearn without an account. Create a free account to read the rest.
Create free account