D2 7.1, 7.2 - Decision trees, EMVs and utility
A decision tree separates what you can choose from what chance decides. You will construct trees with net pay-offs, work backwards to compare expected monetary values, state a complete strategy, and use utility when money alone is not the chosen measure of preference.
Separate choices, chance and pay-offs
Two couriers offer different charging schemes, one with an uncertain cost. One scheme has a lower average monetary cost; the other has a lower average after a cube-root function is applied to each possible charge. Can the same cost data really justify different recommendations? The final part will show exactly how this happens.
First consider a simpler choice. You can run a stall or sell your pitch. Running the stall costs : revenue is with probability , or zero with probability . Selling the pitch gives a certain net profit of . You choose before discovering the stall's revenue.
Decision tree
A decision tree represents a sequence of choices and uncertain outcomes, with the pay-off from each complete course of events shown at an end node. It is read from left to right in the order that decisions are made and information becomes available.
The shapes tell you who controls the next branch. The colours in this lesson help you recognise them; the shape is the mathematical convention.
| Node | Shape | Meaning |
|---|---|---|
| Decision node | Square, | Choose one available action. Outgoing branches are alternatives, not random outcomes. |
| Chance node | Circle, | An uncertain outcome determines the next branch. Label each branch with its outcome and probability. |
| End node | Triangle, | The process ends here. Write the resulting pay-off. |
A branch probability describes its chance on a scale from to . Probabilities leaving a chance node must describe mutually exclusive outcomes that cover all possibilities, so they add to . In the stall example, . Do not put probabilities on the two actions at the decision node: you choose between them.
Pay-off
A pay-off is the final value associated with one complete outcome. For a profit model, it is net profit: receipts minus all costs incurred on that path. A loss is a negative profit. If the question instead uses non-negative total costs, lower values are preferable.
For the stall, the end profits are and , measured in pounds. The sale ends at . The stall cost is paid even if revenue is zero. Once it is included in the end profits, it must not be deducted again during the later calculation.
At a later chance node, the probability shown applies given that this node has been reached. Multiplying probabilities along a path uses the booklet's conditional multiplication rule. It does not require the stages to be independent when the stated probabilities are already conditional.
A decision must appear before the uncertainty if it has to be made before that outcome is known. Moving it to the other side of a chance node would give the decision-maker information they do not have.
Key idea
Squares are choices, circles are chance, and terminal triangles contain complete pay-offs. The position of a decision node records what is known when the choice is made.
Check the meaning of the branches before calculating anything.
Construct the tree and compare monetary values
An expected monetary value is a probability-weighted average of the monetary pay-offs. For example, a profit of with probability and a profit of with probability have average . Neither possible profit is : an EMV is a comparison value, not a promised outcome.
Expected monetary value at a chance node
If the complete, mutually exclusive outcomes have probabilities and monetary values , with , then
Use one consistent monetary scale: maximise net profit, or minimise non-negative total cost. The booklet supplies this as the general expectation formula , rather than under the name EMV.
In the formula booklet.
To construct a tree, draw the choices in chronological order, add chance outcomes and their probabilities, and write each complete net pay-off at a triangular end node. Then evaluate it from right to left, a process called rollback.
At a chance node, calculate the weighted average. At a decision node, retain the most favourable available value. Write the selected value at the decision node and put two short parallel strokes across each strictly inferior action branch. If two actions tie, neither is strictly inferior under that criterion. This rollback procedure and its branch-marking convention are not printed in the formula booklet.
The first example completes the stall tree introduced above.
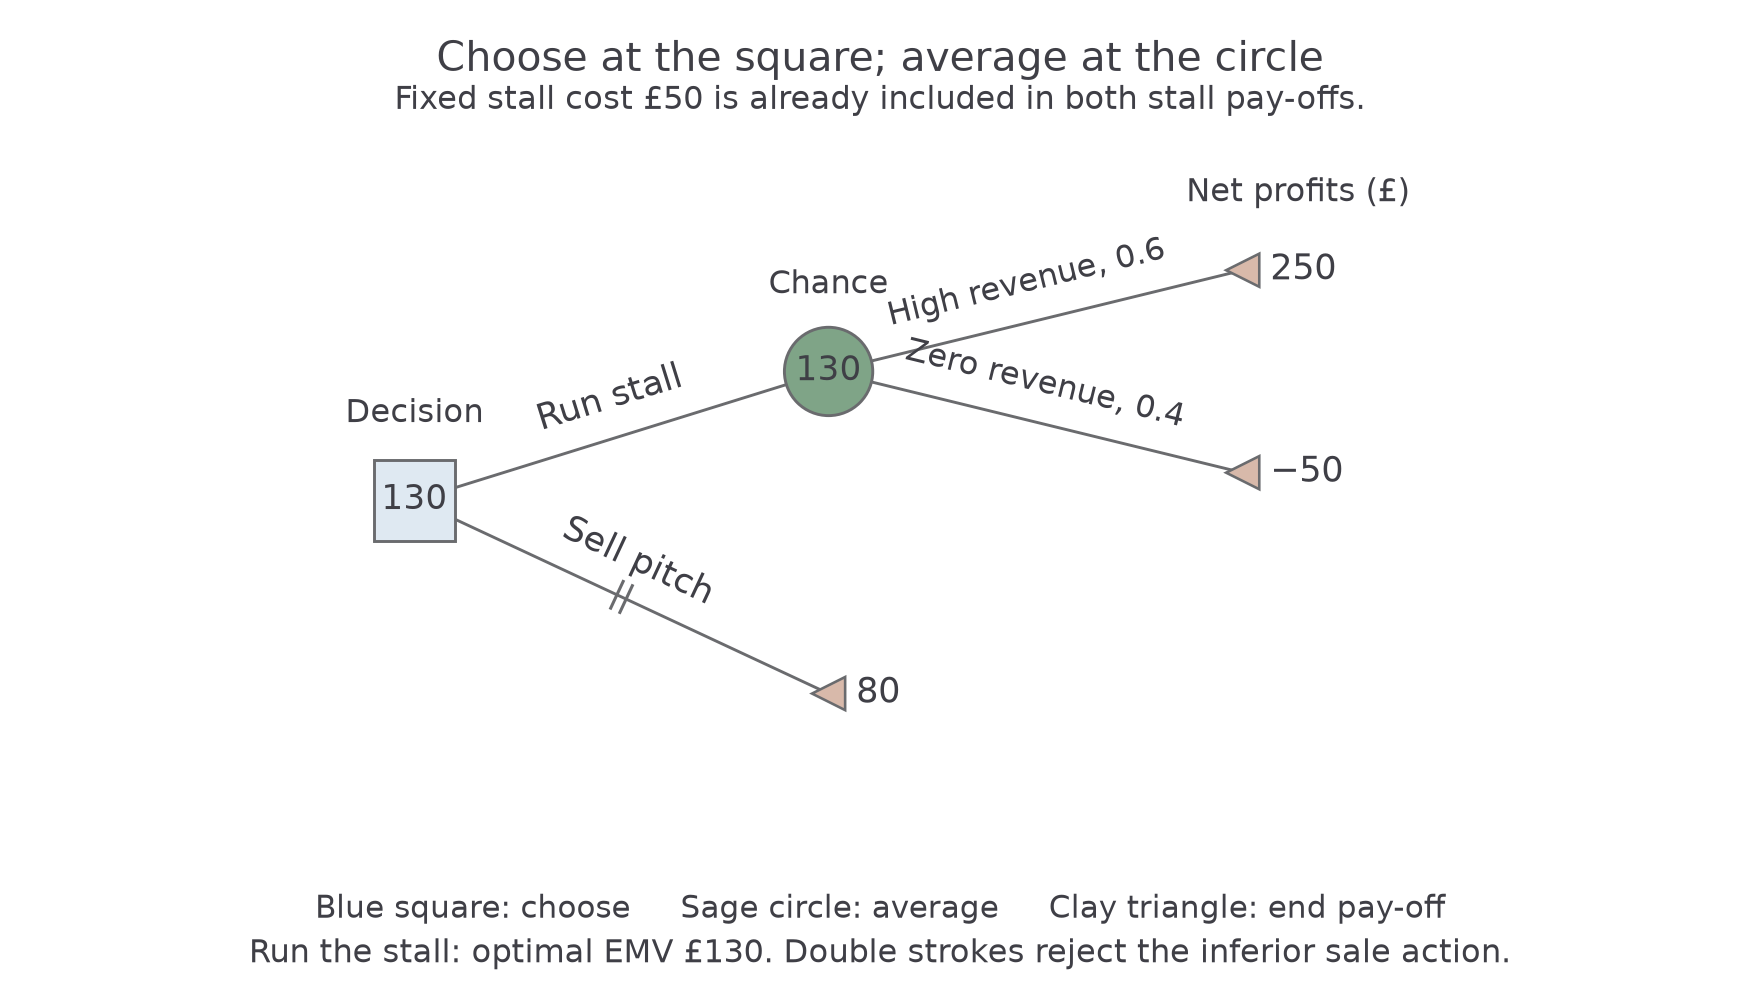
[DIAGRAM: asset_name: A completed one-stage decision tree; asset_slug: 9fm0-d2-194-stall; caption: Average at the chance node, then choose at the decision node; description: A blue square decision node with value one hundred and thirty has an upper Run stall branch to a sage circular chance node also valued one hundred and thirty, and a lower Sell pitch branch to a clay terminal triangle with profit eighty. The chance node has High revenue probability zero point six leading to terminal profit two hundred and fifty and Zero revenue probability zero point four leading to terminal profit minus fifty. Two grey strokes cross the inferior Sell pitch branch. A key identifies square decision, circle chance and triangle end pay-off. All end values are net profit in pounds, including the fifty pound stall cost.]
Worked example 1: include the cost in every stall outcome
Question. Draw and evaluate a decision tree for the stall choice with fixed cost , revenue with probability or zero with probability , and the alternative certain net profit . State the strategy that maximises EMV.
Plan. Put the action choice first, use a chance node only for running the stall, calculate both net stall profits, then roll back.
The tree has one decision square, one chance circle and three terminal triangles. The diagram shows all three pay-offs, both chance probabilities and the completed node values. The sale branch is crossed with two strokes.
Why is the sale not averaged with the stall? They are alternative actions, not two uncertain outcomes of one chosen action.
Answer. Run the stall. The optimal EMV is .
Check. Expected revenue is , so expected profit is . This agrees with averaging the two net profits.
Worked example 2 changes only the stall's fixed cost, from to . Revenue probabilities, possible revenues and the sale offer remain unchanged.
Worked example 2: a tie at the decision node
Question. Construct and evaluate the same tree when the fixed stall cost is . State every action that is optimal under the EMV criterion.
Plan. Keep the same connections and chance labels, update both stall pay-offs, then compare with the unchanged sale.
| Tree entry | Updated value or label |
|---|---|
| Upper chance outcome | High revenue, probability , end profit . |
| Lower chance outcome | Zero revenue, probability , end profit . |
| Stall chance node | . |
| Sale terminal node | . |
| Initial decision node | ; retain both tied actions. |
[DIAGRAM: asset_name: Completed stall tree at the tie cost; asset_slug: 9fm0-d2-194-stall-100; caption: Both actions remain optimal when the fixed stall cost is one hundred pounds; description: A blue square decision node with value eighty offers Run stall and Sell pitch. Run stall leads to a sage chance circle valued eighty. High revenue probability zero point six ends at a clay triangle with net profit two hundred; zero revenue probability zero point four ends at a clay triangle with net profit minus one hundred. Sell pitch ends at a clay triangle with net profit eighty. No branch is crossed because the actions tie under the EMV criterion. All monetary values are profits in pounds.]
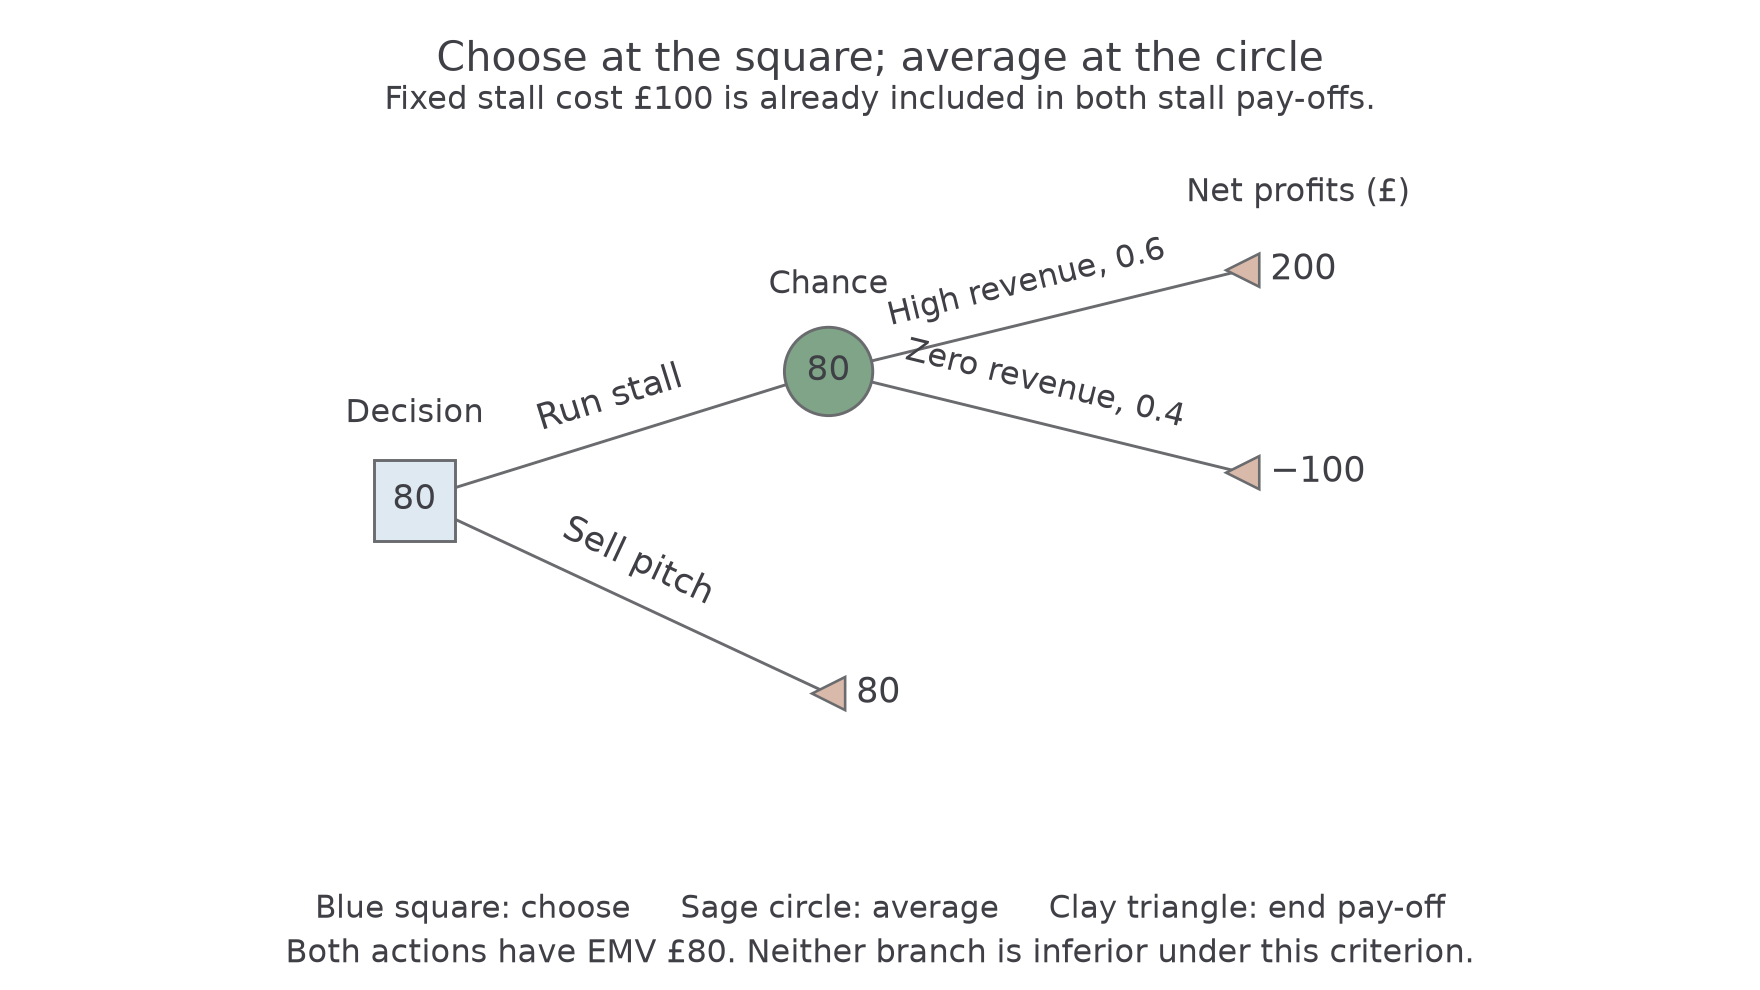
Why keep both branches? Equal EMVs give no unique monetary-average recommendation. The sure and uncertain or remain different outcomes despite their equal averages.
Answer. Either run the stall or sell the pitch: both have EMV .
Check. Expected stall profit is again expected revenue minus fixed cost, .
For a general fixed cost , stall EMV is . It exceeds the sale's exactly when ; at they tie. This threshold follows from the same calculation and is not a separate booklet result.
Watch out
Wrong: use revenue as the high-outcome profit while using for the low outcome, or subtract again after averaging profits that already include it. Right: use and , then count that cost once.
Change only the fixed cost again. Draw the updated tree as well as giving the arithmetic.
Continue this lesson.
You’re previewing NovaLearn without an account. Create a free account to read the rest.
Create free account