D1 4.5, 4.6 - Resource histograms and scheduling
Construct and interpret resource histograms, move non-critical work to reduce peaks, and produce schedules using the least possible number of workers. You will check both the timing constraints and the allocation of individual workers.
Count workers, then check when they are needed
Our project contains exactly hours of work and must finish in hours. Two workers supply exactly worker-hours. Surely that is enough? Surprisingly, the dependencies force a period when one of those workers has nothing available to do. We will prove why the project needs three workers even though its average demand is only two.
You already know
The project has duration hours and critical path . Total float permits some non-critical activities to move, provided their dependencies and the project deadline remain satisfied. A worker lower bound comes from rounding total worker-hours divided by the available time upwards; it does not by itself prove that a schedule exists.
Keep the same activity data. Unless a question changes the requirement, each activity needs one worker throughout its duration.
| Activity | Duration / hours | Immediate predecessors | Earliest interval |
|---|---|---|---|
| None | |||
| None | |||
The endpoint , for example, can be both the finish of and the start of . When counting workers, use intervals of the form : the finishing task releases its workers at , when another task may start. Do not count both at that instant.
Resource histogram
A resource histogram shows the number of workers required against time for a specified set of activity start times. Its height on an interval is the sum of the worker requirements of all activities running then. Its area is total worker-hours.
A two-worker activity of duration occupies two workers simultaneously for all four hours. It contributes worker-hours; this does not mean one worker can perform it in hours. Use the given durations and worker requirements. In the schedules here, activities run continuously, with the same assigned worker or team throughout; do not interrupt an activity or hand it from one worker to another.
Key idea
A histogram describes demand for the chosen activity timings. A schedule must also name workers, fit their activities without overlaps, and respect every predecessor. Lowering the tallest bar requires a feasible change of timings.
Distinguish simultaneous demand from total work.
Split the time axis whenever an activity starts or finishes
List every distinct start and finish time. Between consecutive times the set of running activities is constant, so add their worker requirements and draw a rectangle of that height. Label both axes and use a clear time scale. Merge neighbouring intervals of equal height if desired, while retaining enough labels to recover the timings.
Only real duration bars use workers. A float extension is a choice of where work could move; it does not itself add resource demand. Dummies need no workers.
Workers and worker-hours
For a chosen schedule,
Here is the worker requirement and the duration of activity . The area of the resource histogram is .
Not in the formula booklet: learn it.
Start with earliest timings and one worker per activity.
Worked example 1: an earliest-start histogram
Question. Construct the resource histogram for the original earliest-start intervals and state its peak.
Plan. Split at , then count the running activities.
| Time interval | Running activities | Workers |
|---|---|---|
Why this step? finishes at , so the height falls then; at , finishes and starts, leaving the same height but a different pair of activities.
Answer. The left-hand histogram below, with peak demand workers on .
Check. Its area is
equal to the sum of the eight one-worker durations.
Keep every duration and start time fixed; change only 's requirement from one worker to two.
Worked example 2: one activity needs a larger team
Question. Update the histogram when requires two workers, all other requirements remaining one.
Plan. Add one worker precisely while runs, from to .
Every other height is unchanged.
Why this step? Two workers on means one more than the worker already counted. Adding two to the old histogram would count its original worker twice.
Answer. The right-hand histogram below, with peak workers.
Check. The additional area is , so the total becomes worker-hours, also .
[DIAGRAM: asset_name: Earliest resource histograms with one changed requirement; asset_slug: 9fm0-d1175-histogram-comparison; caption: Changing E's team adds one worker only during its four-hour interval; description: Two side-by-side resource histograms use a 0 to 12 hour time axis and a common vertical scale 0 to 6 workers. The first has heights 2 on 0 to 3, 1 on 3 to 4, 4 on 4 to 5, 3 on 5 to 6, 2 on 6 to 10 and 1 on 10 to 12. The second adds one worker from 4 to 8 only, reaching height 5. Each plateau has its height labelled in dark ink. Titles identify one worker each and E needs two workers.]
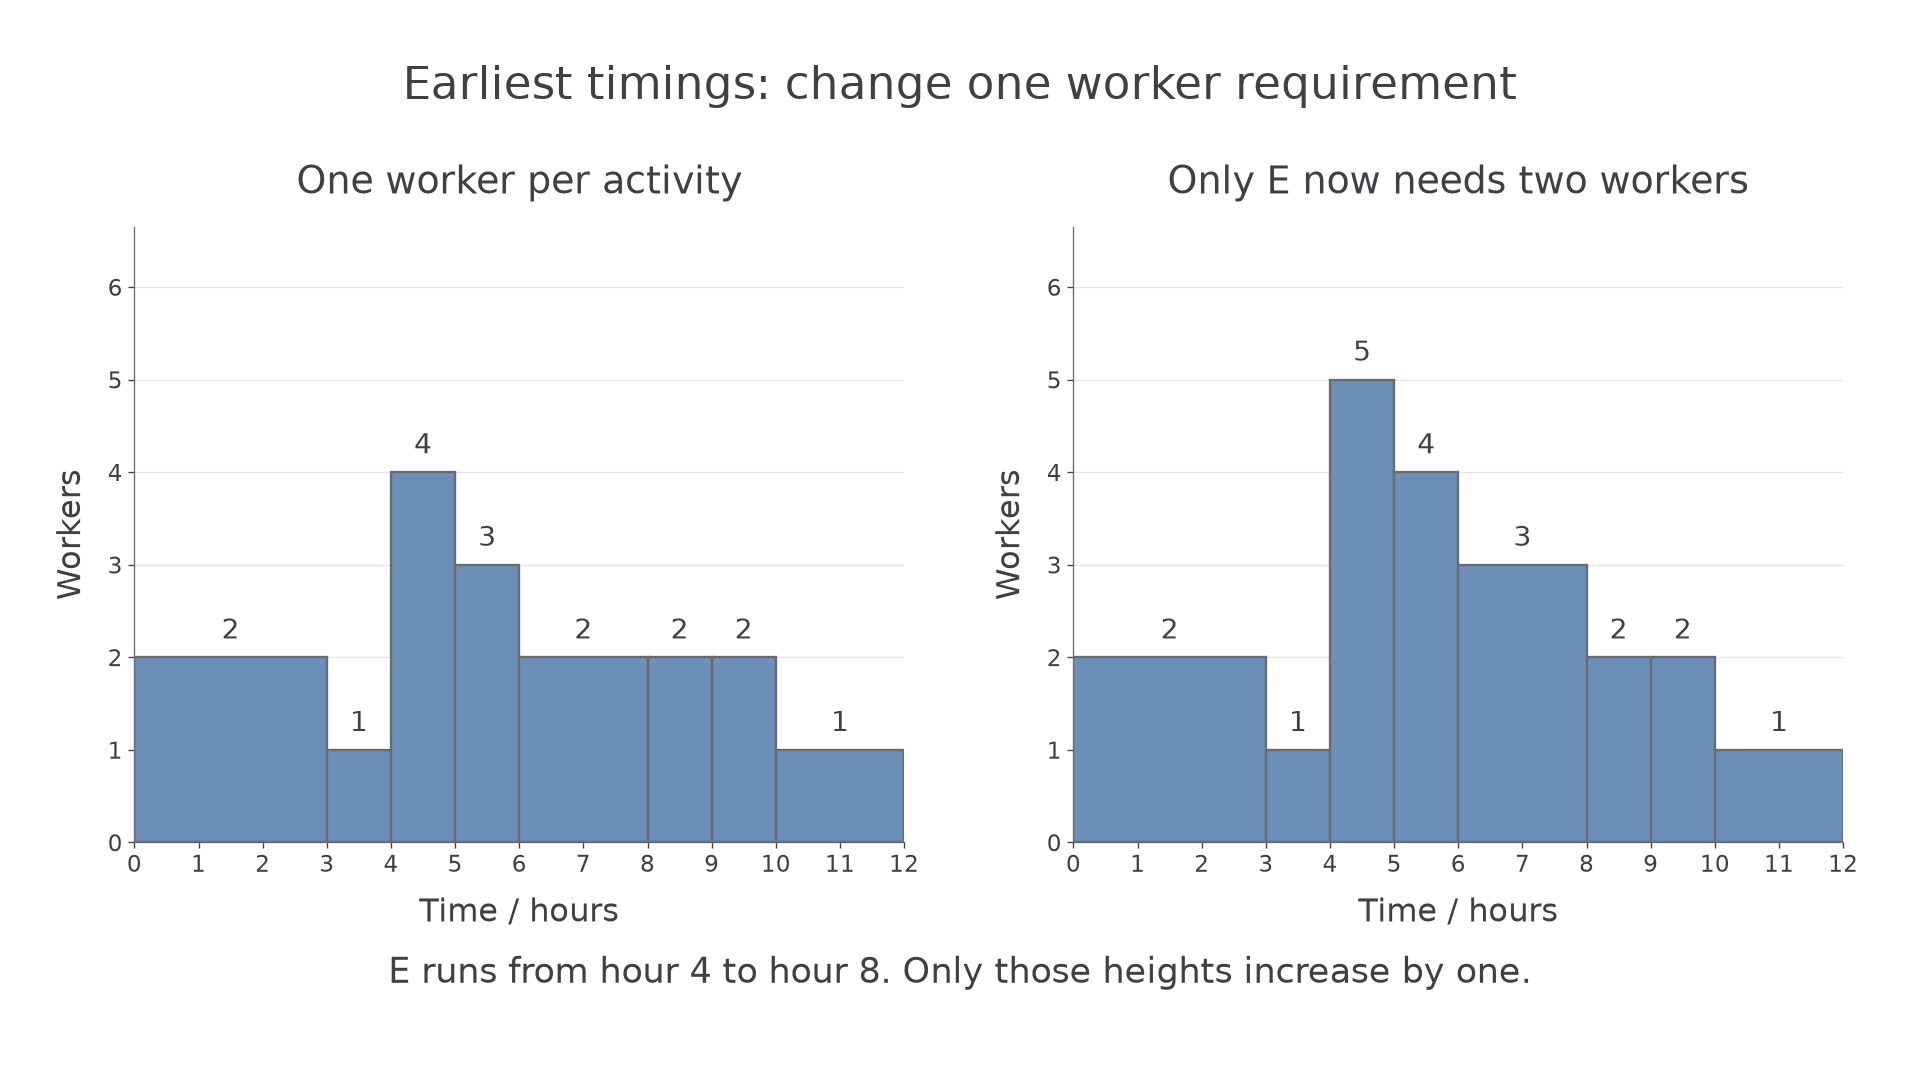
The histogram construction method is not in the formula booklet. Its area gives a useful arithmetic check, while the interval table checks that the workers appear at the correct times.
Watch out
Wrong: count activities when their requirements differ. Right: add the given worker requirements of the activities running on that interval.
Change one requirement again, keeping the original timings and every other requirement equal to one.
Read a histogram backwards by subtracting known demands
You may know the activity timings and the histogram but need to recover worker requirements. Write “sum of requirements of running activities equals the height”. Begin on an interval containing just one activity, then use overlapping intervals to find the others. A one-hour width does not mean one worker: use the height.
For the next examples, retain all original earliest timings but use the new histogram below. The labels show its heights; the worker requirements are to be deduced.
[DIAGRAM: asset_name: Resource histogram for recovering worker requirements; asset_slug: 9fm0-d1175-weighted-histogram; caption: Known activity timings turn each height into an equation for worker requirements; description: A resource histogram on a 0 to 12 hour axis has heights 3 on 0 to 3, 2 on 3 to 4, 6 on 4 to 5, 5 on 5 to 6, 4 on 6 to 8, 3 on 8 to 10 and 2 on 10 to 12. All heights and break times are labelled in dark ink, including the unchanged height at time 9. A note states that the original earliest activity timings apply.]
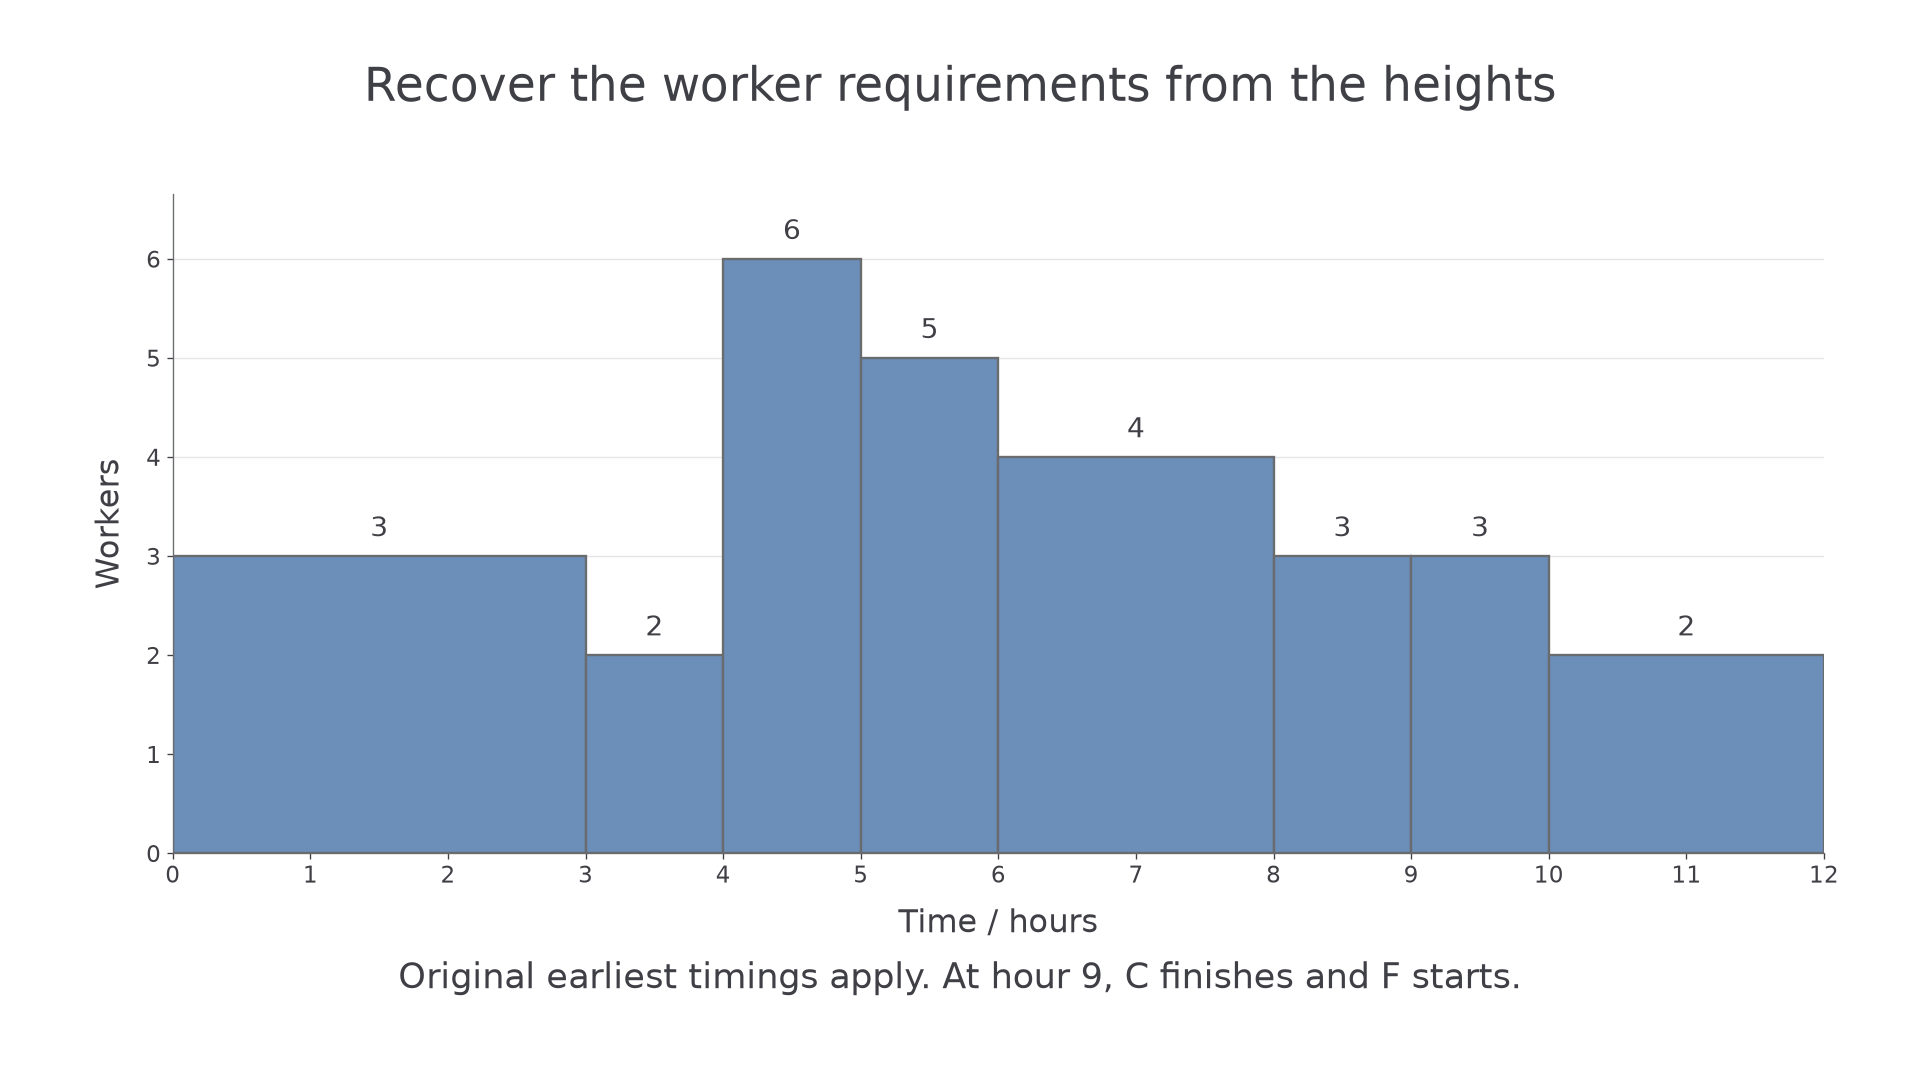
Work backwards from the last interval, where only is running.
Worked example 3: separate a late overlapping pair
Question. Deduce the worker requirements of and .
Plan. Find alone, then subtract its requirement where overlap.
Why this step? On , has not started; although the height is also , that interval contains .
Answer. requires two workers and one.
Check. Their overlap needs , as plotted, and the drop at removes exactly 's one worker.
Keep the same histogram and change only the pair of unknown requirements under investigation, from to .
Worked example 4: continue through the earlier overlaps
Question. Given , deduce the worker requirements of .
Plan. Use first; once is known, use .
Why this step? Choose intervals where the other requirements are already known. The highest bar mixes four activities and is a poor starting point.
Answer. Both require two workers.
Check. Their four-worker overlap lasts from hour to hour , exactly the height shown.
The same subtraction gives from and from . The complete recovered requirements will be used in the final scheduling example:
| Activity | ||||||||
|---|---|---|---|---|---|---|---|---|
| Workers |
These equations are derived from the running-activity sets; there is no separate formula-booklet rule for recovering requirements.
Exam tip
State the interval and running activities used in each equation. This makes the deduction checkable even when adjacent histogram bars have equal heights.
Finish the deduction for the two short activities.
Watch out
Wrong: two simultaneous activities always make a histogram height of . The height is the sum of their worker requirements: if each need , their joint contribution is . Form an equation from the exact running-activity set in the chosen time interval.
Choose intervals whose other worker requirements are already known.
Continue this lesson.
You’re previewing NovaLearn without an account. Create a free account to read the rest.
Create free account