D1 4.4 - Total float and Gantt charts
Calculate total float and display activity timings in a Gantt, or cascade, chart. You will distinguish a flexibility window from a chosen schedule and check how delaying one activity affects its successors.
Float is permitted delay, not additional work
In the project from the preceding lesson, and each have total float hours. Does that give their chain hours of spare time? No: delaying by hours uses the room that also appeared to have. We will calculate the remaining flexibility rather than spending it twice.
You already know
Forward and backward passes give early event times and late event times . For an activity of duration , ES is , EF is , LF is and LS is . A critical activity has ES equal to LS.
Use the original project, with one worker needed for each real activity throughout its duration. Its timing data are:
| Activity | Duration | ES | EF | LS | LF |
|---|---|---|---|---|---|
All times are hours from the project start. The project takes hours; its critical path is . Activity follows , while follows both .
Total float
The total float of an activity is the amount by which its start can be delayed from its earliest start without delaying project completion, provided the remaining activities are timed consistently with their dependencies.
It is not the duration of the activity, nor a promise that every activity can independently use its full float at once.
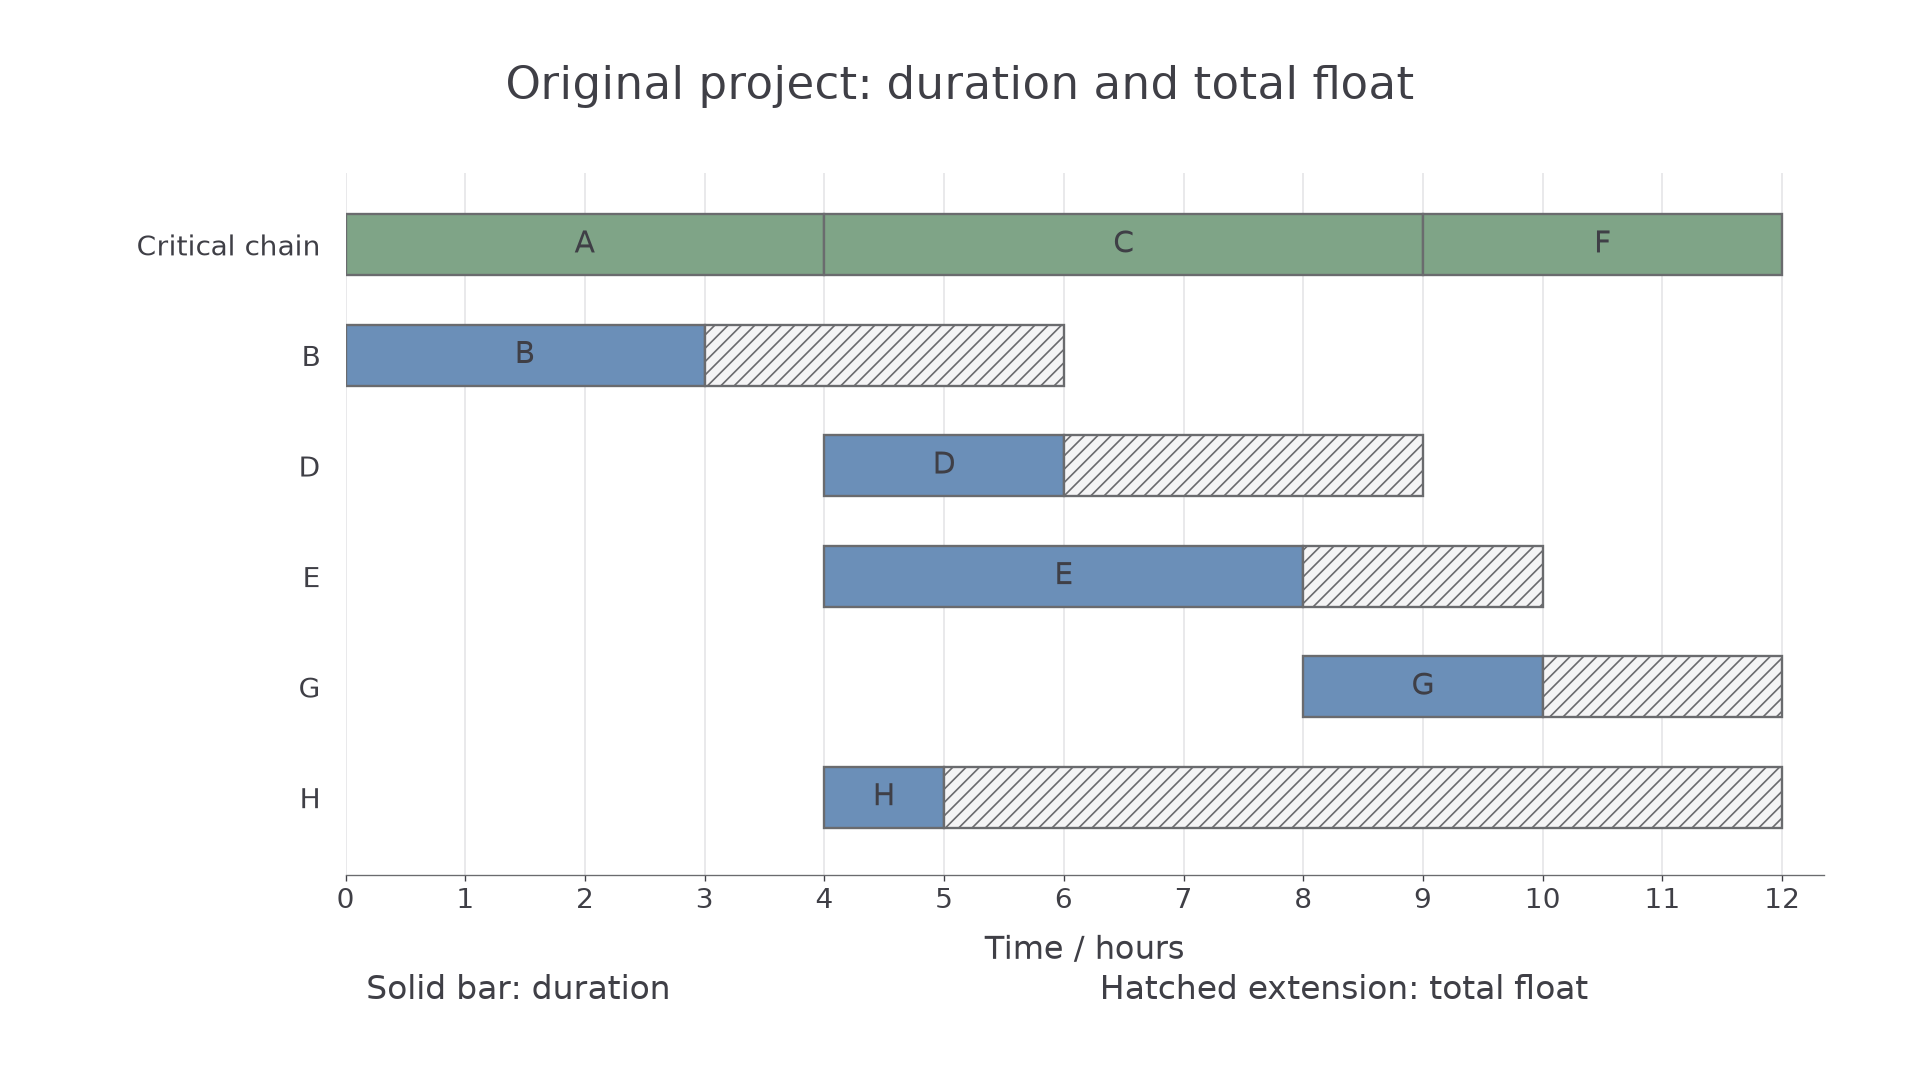
A Gantt chart displays a real duration bar and a float extension. Only the duration bar represents work. The extension shows where the bar could move; it is not another task occupying a worker.
Key idea
Float belongs to the timing constraints of the network. A gap visible in one particular worker schedule need not equal an activity's total float.
Check what a float extension means.
Subtract the earliest finish from the latest finish
The latest finish minus the earliest finish measures the activity's available delay. Using LS minus ES gives the same result, since both finishes differ from their starts by the same duration.
Total float
For activity of duration ,
For a minimum-time project with consistent data, total float is non-negative. Critical activities have total float .
Not in the formula booklet: learn it.
Use the head event's late time and tail event's early time. Mixing two early times can give a different kind of gap and miss some flexibility.
Worked example 1: an activity with an unfixed head event
Question. Calculate the total float of , duration , where .
Plan. Use the late head time, then check with the activity's two start times.
Why this step? Using would produce , just the early-event gap after . Total float must use .
Answer. has total float hours.
Check. It can start at hour and finish at hour , its latest finish, with downstream activities adjusted consistently.
Change only the activity being examined, to .
Worked example 2: another branch
Question. Find the total float of , duration , where .
Plan. Subtract its earliest start and duration from the late head time.
Why this step? The tail's late event time is , but subtracting that instead of its early time would incorrectly remove the available start flexibility.
Answer. Total float hours.
Check. Starting at hour gives finish , still allowing 's two hours before the project finish at .
Applying the same formula gives total floats for , respectively. The calculation uses the network, even if a displayed schedule happens to start a task later than ES.
Watch out
Wrong: call a one-hour wait in a chosen schedule the activity's total float. Right: use , then explain how the schedule uses part of that available allowance.
Use the successor from worked example 2.
Draw duration bars and float extensions on one time axis
In a Gantt, or cascade, chart, place a real duration bar from ES to EF. Extend that row from EF to LF with a clearly different shading or hatching to represent total float. The row's full width is duration plus float; its duration bar may be shifted within the window if the resulting schedule remains feasible.
Group the critical activities at the top. They may form a single consecutive row when they lie on the same critical path; otherwise separate labelled critical rows are clear. Put each non-critical activity on its own row and include every real activity exactly once. Do not add a worker row for a dummy.
This chart convention and its construction method are not in the formula booklet.
[DIAGRAM: asset_name: Gantt chart for the original project; asset_slug: 9fm0-d1174-original-gantt; caption: Duration bars represent work and hatched extensions represent total float; description: A common time axis from 0 to 12 hours has critical activities A from 0 to 4, C from 4 to 9 and F from 9 to 12 along the top row. The separate non-critical rows show B duration 0 to 3 and float 3 to 6; D duration 4 to 6 and float 6 to 9; E duration 4 to 8 and float 8 to 10; G duration 8 to 10 and float 10 to 12; H duration 4 to 5 and float 5 to 12. Real bars have clear outlines and activity labels in ink; float sections are hatched. A key is outside the chart.]
Worked example 3: construct the full cascade chart
Question. Draw the Gantt chart for the original timing table.
Plan. Put the critical chain at the top, then draw each non-critical duration and its separate float extension.
| Row | Real duration interval | Float extension |
|---|---|---|
| Critical chain | None | |
Why this step? Draw each activity's earliest bar and its flexibility window, rather than assigning activities to a small number of workers. A worker allocation is a different diagram.
Answer. The pictured Gantt chart, with all eight real activities appearing once.
Check. Each real bar's width is its duration; each extension's width agrees with the calculated total float. The critical row runs continuously from to .
Continue this lesson.
You’re previewing NovaLearn without an account. Create a free account to read the rest.
Create free account