FS2 3.1 - Product moment correlation coefficient
The product moment correlation coefficient measures linear association on a scale that does not depend on ordinary measurement units. You will calculate it from summaries, recognise when it is informative and track the effect of coding either variable.
A zero coefficient can hide a perfect curve
Can two variables follow an exact relationship and still have product moment correlation zero?
Take and . Every point obeys , yet the product moment correlation coefficient is zero. The upward and downward parts of the curve cancel in its measure of linear association.
You already know
From regression, measures centred variation in the explanatory values and measures their centred cross-product with the response. Inspecting a scatter diagram helps judge whether a line is reasonable. Association alone does not establish causation.
Correlation treats the variables symmetrically; exchanging their roles does not change the coefficient. A regression slope does depend on which variable is the response.
Product moment correlation coefficient
The sample product moment correlation coefficient, or PMCC, is denoted by . For two non-constant quantitative variables it measures the direction and strength of linear association, with
Values and describe exact straight-line relationships with positive and negative slopes respectively. Zero means no linear correlation, not necessarily no relationship. The population coefficient is denoted by .
Use correctly paired quantitative measurements on the same individuals or cases. A nearly linear scatter without a dominating unusual point makes a single linear summary more informative. Ordinal ratings or a curved relationship may call for a different description; the coefficient can still be calculated where its denominator is non-zero, but it need not capture the pattern well.
[DIAGRAM: asset_name: An exact curve with zero linear correlation; asset_slug: 9fm0-fs2-124-zero-pmcc; caption: PMCC measures linear association rather than every possible relationship; description: Five exact points at x minus two,minus one,zero,one,two and y four,one,zero,one,four lie on the parabola y equals x squared. The curve is shown faintly behind the points. A side panel states that Sxy equals zero and r equals zero despite the exact curved relationship. A note says a zero coefficient does not mean there is no association]
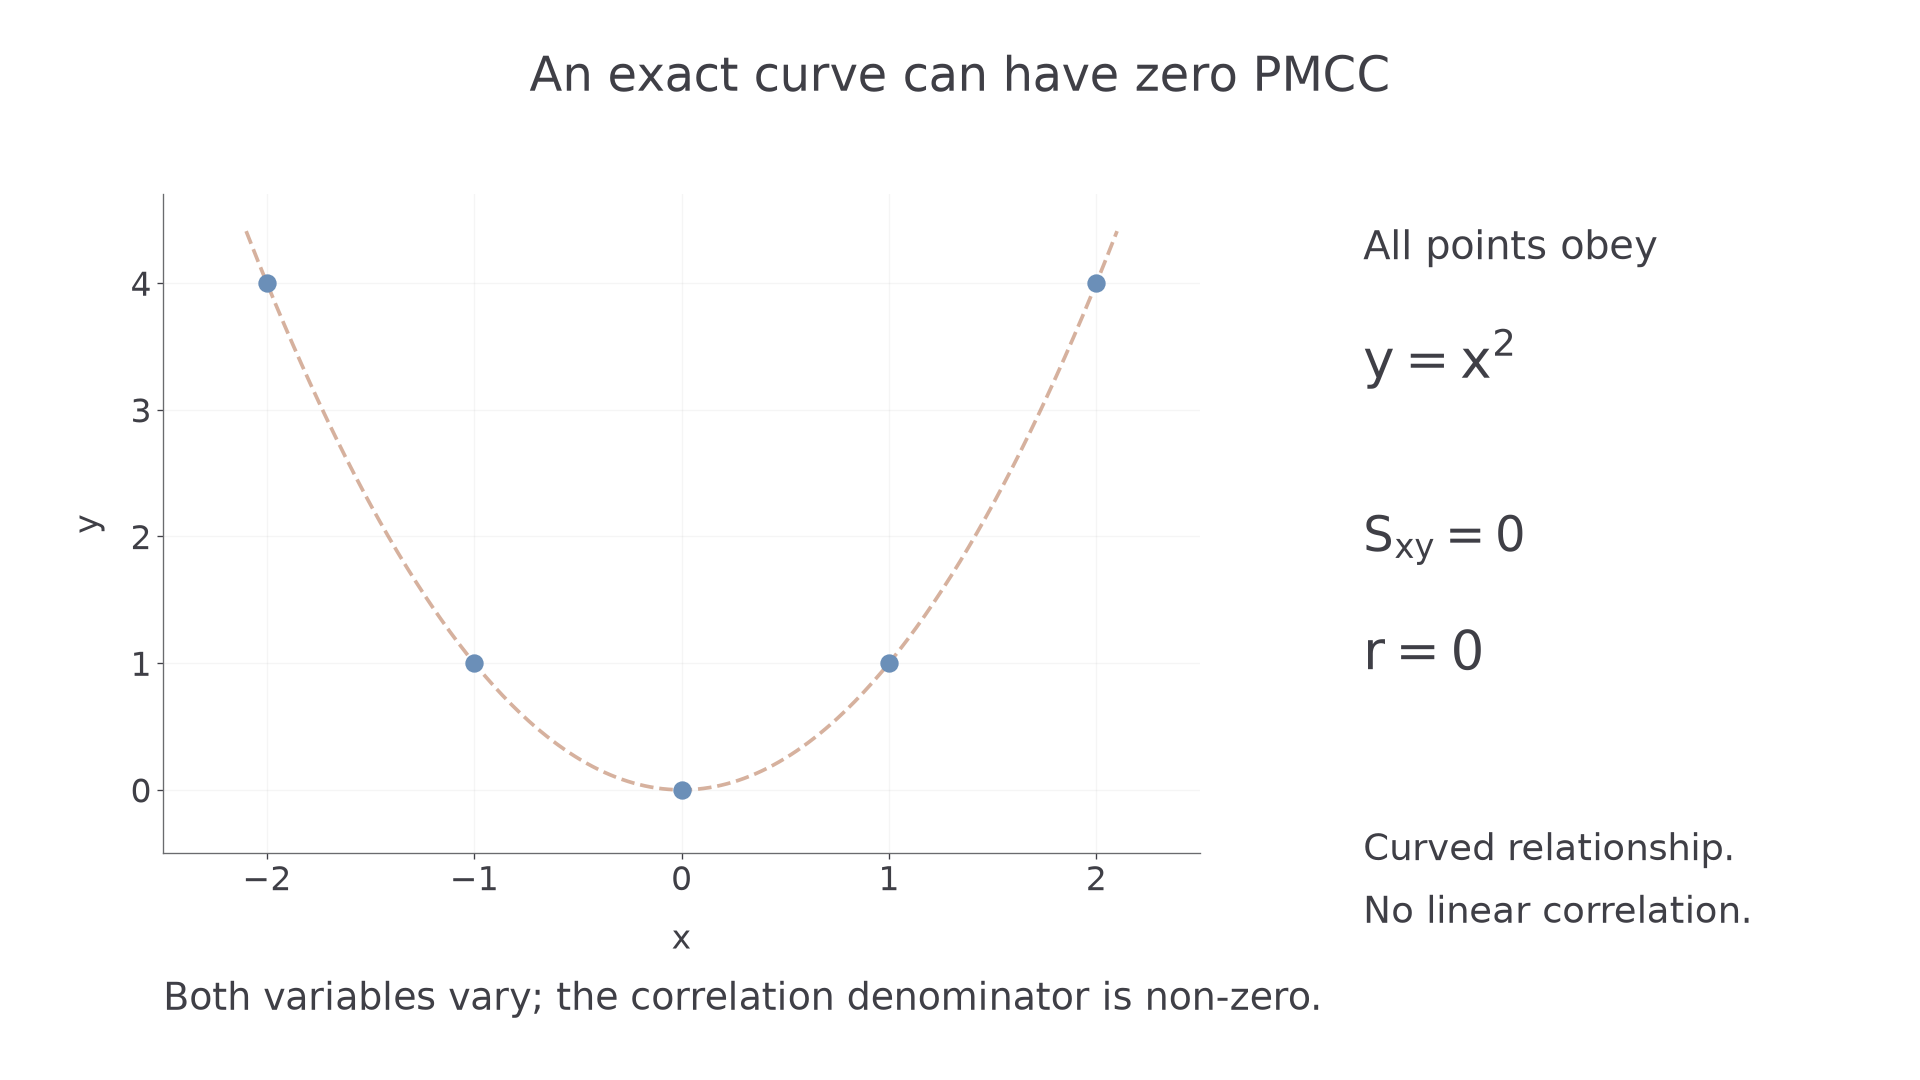
The population assumption for a formal PMCC critical-table test is stronger: the paired variables should come from a bivariate normal population. This is a joint distribution assumption, not merely a claim that each variable separately looks normal. Formal verification is not required. Normality is not needed just to evaluate the descriptive coefficient.
Key idea
Read PMCC with the scatter diagram: a linear coefficient can miss curvature or be strongly affected by an unusual point.
Use the opening curve to test the interpretation.
Calculating PMCC from paired summaries
Use the same observations in all summaries. Centre both variables before combining their variation; a raw cross-product alone depends on the locations of the measurement scales.
Product moment correlation coefficient
For paired observations with and ,
The denominator is positive, so has the sign of . The coefficient is undefined if either variable is constant. In the formula booklet.
Unlike regression slope, this expression divides by a square root involving both variables. The units cancel, leaving a dimensionless coefficient.
Worked example 1: a positive coefficient
Question. Five paired observations have
Calculate PMCC to three significant figures.
Plan. Find the centred sums and use the supplied coefficient formula.
Why this step? Dividing by alone would give a regression slope, not correlation.
Answer. , indicating positive linear association in this sample.
Check. The sign matches , and the magnitude lies below .
Continue this lesson.
You’re previewing NovaLearn without an account. Create a free account to read the rest.
Create free account