FS1 6.1 - Goodness of fit tests
A model predicts a whole pattern of frequencies, not just a mean. You will compare observed and expected counts using a chi-squared goodness of fit test, pool small expected cells and adjust the degrees of freedom when parameters are estimated from the data.
Measuring the discrepancy from a model
Is an excess of five observations equally surprising when a model expected five and when it expected fifty?
No. The chi-squared contribution is in the first case, but in the second. The same numerical discrepancy receives ten times as much weight against the smaller expectation. A goodness of fit test combines these scaled discrepancies across all categories.
You already know
A model assigns probabilities that are non-negative and sum to . Earlier FS1 lessons supply binomial, Poisson and geometric probabilities and their parameter conditions. A null hypothesis describes the population model being tested; an observed sample does not have to match its expectations exactly.
The categories must be mutually exclusive and cover every possible outcome. For an unbounded count, a final category such as “at least ” includes the entire remaining tail.
Observed and expected frequencies
An observed frequency is the number of sample observations in category . Its expected frequency is the count predicted by the null model for that same sample size. Expected frequencies need not be integers.
If each observation has null probability of falling in a category, multiply by the number sampled.
Expected category frequencies
For independent observations classified into exhaustive categories with null probabilities ,
Retain unrounded expected frequencies in later calculations. Not in the formula booklet: learn it.
Squaring the discrepancies prevents positive and negative differences from cancelling. Dividing by their expectations makes the comparison sensitive to the model's predicted scale.
Chi-squared discrepancy statistic
For the categories retained in the test, with ,
Under a suitable null model, has an approximate chi-squared distribution with the appropriate degrees of freedom. Its approximation requires sufficiently large expected frequencies. In the formula booklet.
The statistic is non-negative and is zero only when every retained observed count equals its expectation. A large value indicates poor agreement. If the null gives a category probability zero but that category is observed, the proposed model is already contradicted; do not divide by zero in this formula.
Worked example 1: a discrete uniform model
Question. A spinner has four labelled outcomes. In independent spins the counts are . Assuming a discrete uniform model, find the expected frequencies and .
Plan. Equal outcome probabilities give equal expectations; calculate all four contributions.
Why this step? Subtracting raw discrepancies would give zero because both sets total . Their squares measure disagreement instead.
Answer. All four expected frequencies are , and .
Check. The expectations total , and every contribution is non-negative.
Worked example 2 changes only the observed counts, bringing them closer to the same null expectations.
Worked example 2: closer agreement
Question. Repeat the calculation if the counts are .
Plan. Keep all expected frequencies at .
Why this step? Expectations come from the null probabilities and sample size, not by adjusting them to resemble the observed counts.
Answer. .
Check. A smaller discrepancy produces a smaller statistic. Whether either value is significant also depends on the degrees of freedom and significance level.
Use counts, rather than percentages substituted as though they were observations.
Watch out
Wrong: use , round expected counts to whole numbers, or omit a tail category. Right: divide by , retain precision and check that both frequency totals equal the sample size.
Move the two outer counts again while preserving the total.
Completing a test for a specified distribution
The null hypothesis states the proposed distribution, including fixed parameter values. The alternative says that this distribution is not a suitable model. This is a test of the whole frequency pattern, rather than a one-sided test of a single mean.
With retained categories and all model parameters specified independently of the sample, the degrees of freedom are . One constraint comes from the fixed total: after counts are chosen, the last is determined. This degrees-of-freedom rule is not printed in the booklet.
Right-tail chi-squared decision
Under , use approximately distributed as . At level , either:
or calculate the upper-tail p-value
and reject when it is at most . The chi-squared model is continuous, so a single boundary point has probability zero. The critical-value tables are supplied; the decision rule is not. Not in the formula booklet: learn it.
Both excesses and shortages increase , so goodness of fit uses the upper chi-squared tail. Do not split a significance level into two tails. The booklet table headings are upper-tail probabilities; quote a tabulated critical value in full. A calculator may instead give the corresponding upper-tail p-value.
Worked example 3: testing a binomial model
Question. The counts of successes in independent three-trial experiments are:
| Successes | ||||
|---|---|---|---|---|
| Observed |
Test at the level whether is a suitable model.
Plan. Obtain the four binomial probabilities, check expectations, then compare with .
Why this step? The parameters and were specified, so no parameter has been estimated from these counts.
Answer. , so do not reject . There is insufficient evidence at the level that the binomial model is unsuitable.
Check. A calculator gives upper-tail p-value , agreeing with the critical-value decision.
Worked example 4 changes only the observed counts. The null probabilities, sample size, degrees of freedom and critical value remain the same.
Worked example 4: stronger disagreement
Question. Repeat the test if the observed counts are .
Plan. Keep expectations and recalculate .
Why this step? Changing the data changes the statistic, not a fixed null model's expectations.
Answer. Reject . There is sufficient evidence that is not a suitable model for the experiment counts.
Check. The upper-tail p-value is .
The diagram places the statistic and critical value in the same upper-tail comparison.
[DIAGRAM: asset_name: The upper tail detects poor fit; asset_slug: 9fm0-fs1-111-chi-tail; caption: Large discrepancies fall in the upper tail of the approximate chi-squared reference distribution; description: A chi-squared density curve with three degrees of freedom has the region above the five per cent critical value 7.815 shaded pale clay. A dashed line marks 7.815 and a separate labelled arrow marks the observed statistic 9.6 within the rejection region. The curve is labelled as the approximate null reference distribution, and the shaded area is labelled 0.05]
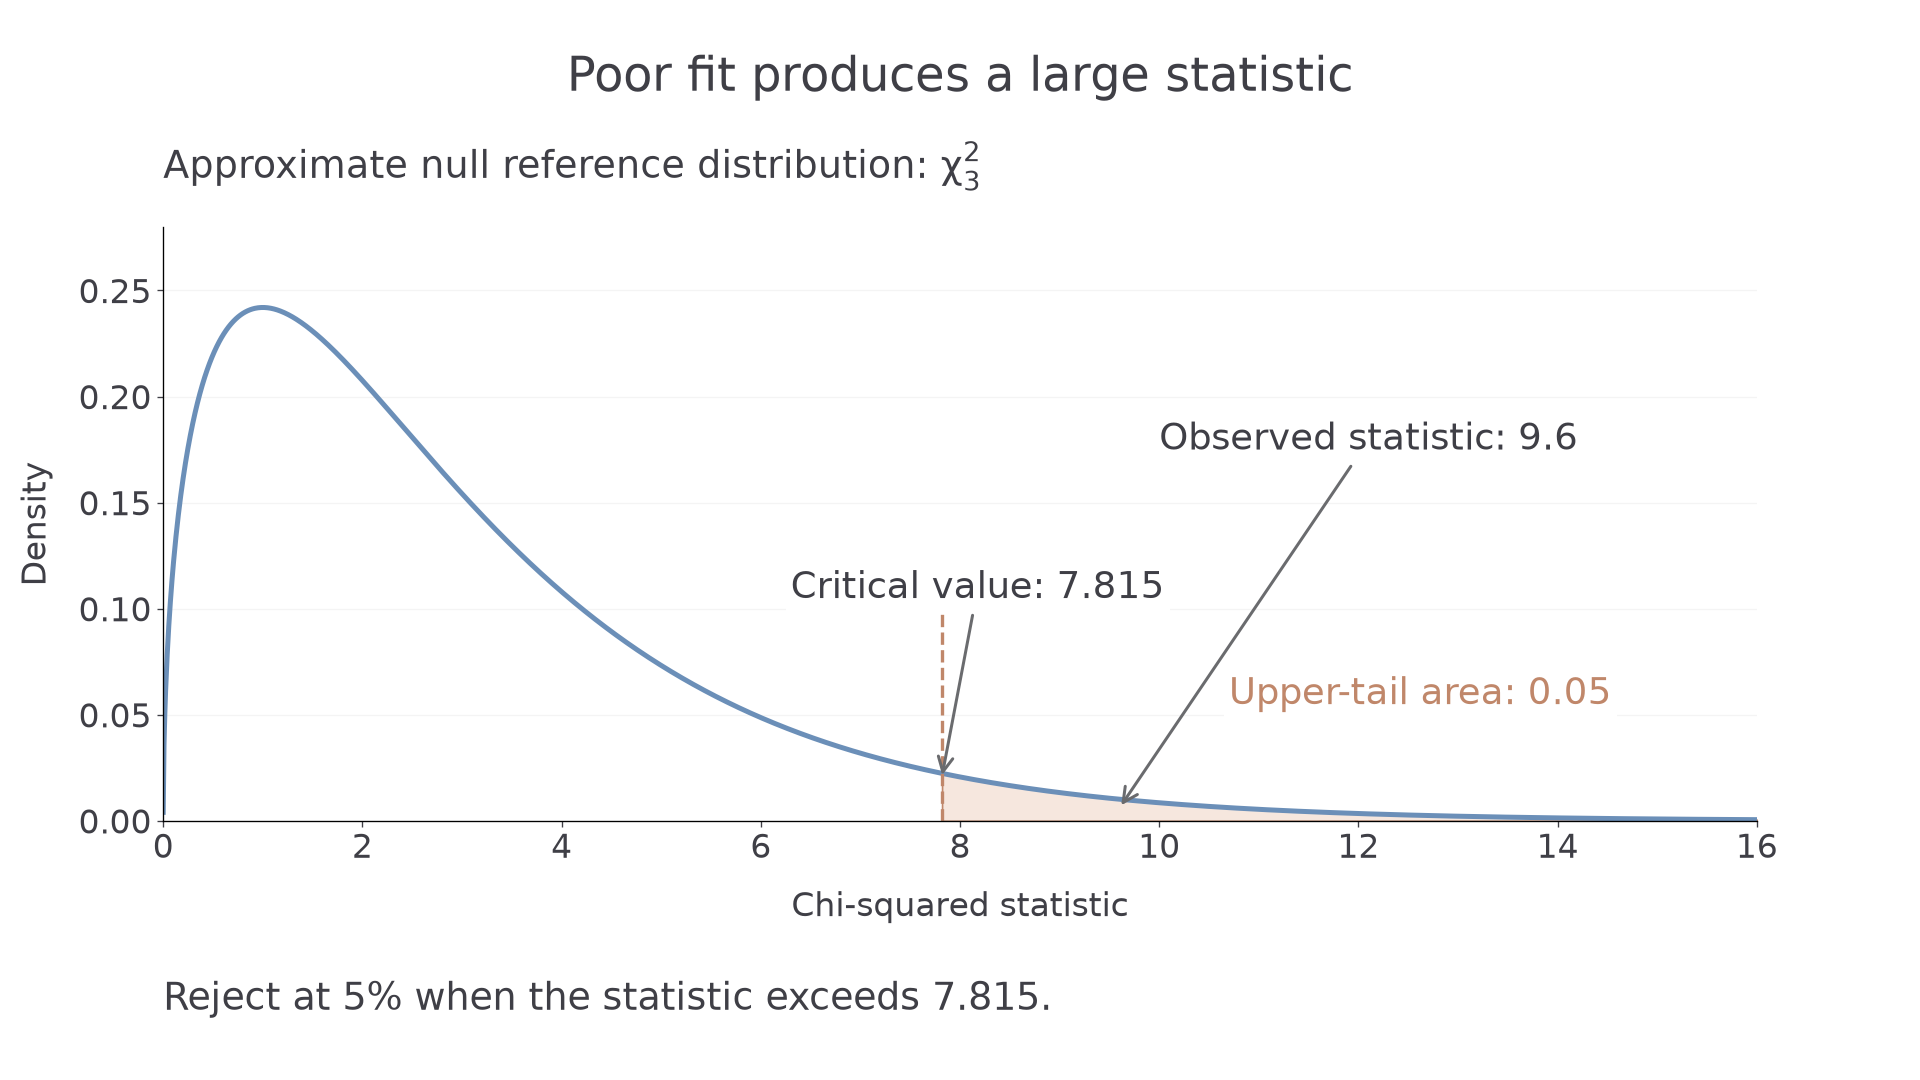
Not rejecting a model does not prove it true. The sample may simply lack evidence against it; a goodness of fit test also does not establish the independence of the underlying observations.
Watch out
Wrong: reject when , or split the stated level between two chi-squared tails. Both excesses and shortages already increase the squared-discrepancy statistic, so large indicates poor fit. Right: use the upper tail and reject when at the stated level; otherwise give an insufficient-evidence conclusion.
The comparison then needs a complete contextual conclusion.
Exam tip
State both hypotheses, the retained categories and expectations, the statistic, degrees of freedom, critical value or p-value, and a conclusion about the proposed model in context.
The final variation lies between the two example datasets.
Continue this lesson.
You’re previewing NovaLearn without an account. Create a free account to read the rest.
Create free account