FS2 2.4 - The continuous uniform distribution
A uniform density gives equal probabilities to equal-length intervals within its support. You will derive its CDF, mean and variance, use interval lengths for probabilities and conditional probabilities, and calculate expectations of quantities that depend on a uniform random measurement.
A rectangle turns probability into a length ratio
A random height has mean . Why can a triangle built from it have mean area , rather than the area obtained by using height ? Equal density does not make nonlinear averaging disappear. First build the simplest continuous model; then you will use it on that triangle.
You already know
A density has total area . Its CDF accumulates area from the left, interval probabilities are CDF differences, and averages the transformed value.
If every equal-length interval inside has the same probability, the density must have one constant height. A rectangle of width needs height to have area .
Continuous uniform distribution
Write , where , when has constant density on and zero density elsewhere. It is also called a rectangular distribution. Equal-length subintervals of the support have equal probabilities; individual point probabilities are still zero.
The interval needs positive width. When , this density formula is undefined; a fixed value is a different kind of model.
Uniform density
For , with ,
In the formula booklet.
The CDF is obtained by integrating this rectangle. Below there is no area; above all the area has accumulated. Between the endpoints,
This is the required derivation, rather than a new formula to quote without explanation.
Uniform CDF
The middle branch is the accumulated width divided by the total width.
Not in the formula booklet: learn it.
For , its difference gives , a derived length ratio rather than a separately printed booklet formula. If a requested interval extends beyond the support, use only its overlap with .
[DIAGRAM: asset_name: Uniform density rectangle and linear cumulative distribution; asset_slug: 9fm0-fs2-123-uniform-cdf; caption: The shaded interval probability is its width divided by the whole support width; description: Two coordinate panels show X uniform on minus two to six. The density panel has a constant rectangle of height one eighth and total area one, with the interval one to four shaded in sage and labelled area three eighths. The CDF panel is zero to the left of minus two, rises linearly from minus two comma zero to six comma one, and stays one afterwards. Guides show F of one equals three eighths and F of four equals three quarters. Axes, support endpoints and all labels are clear.]
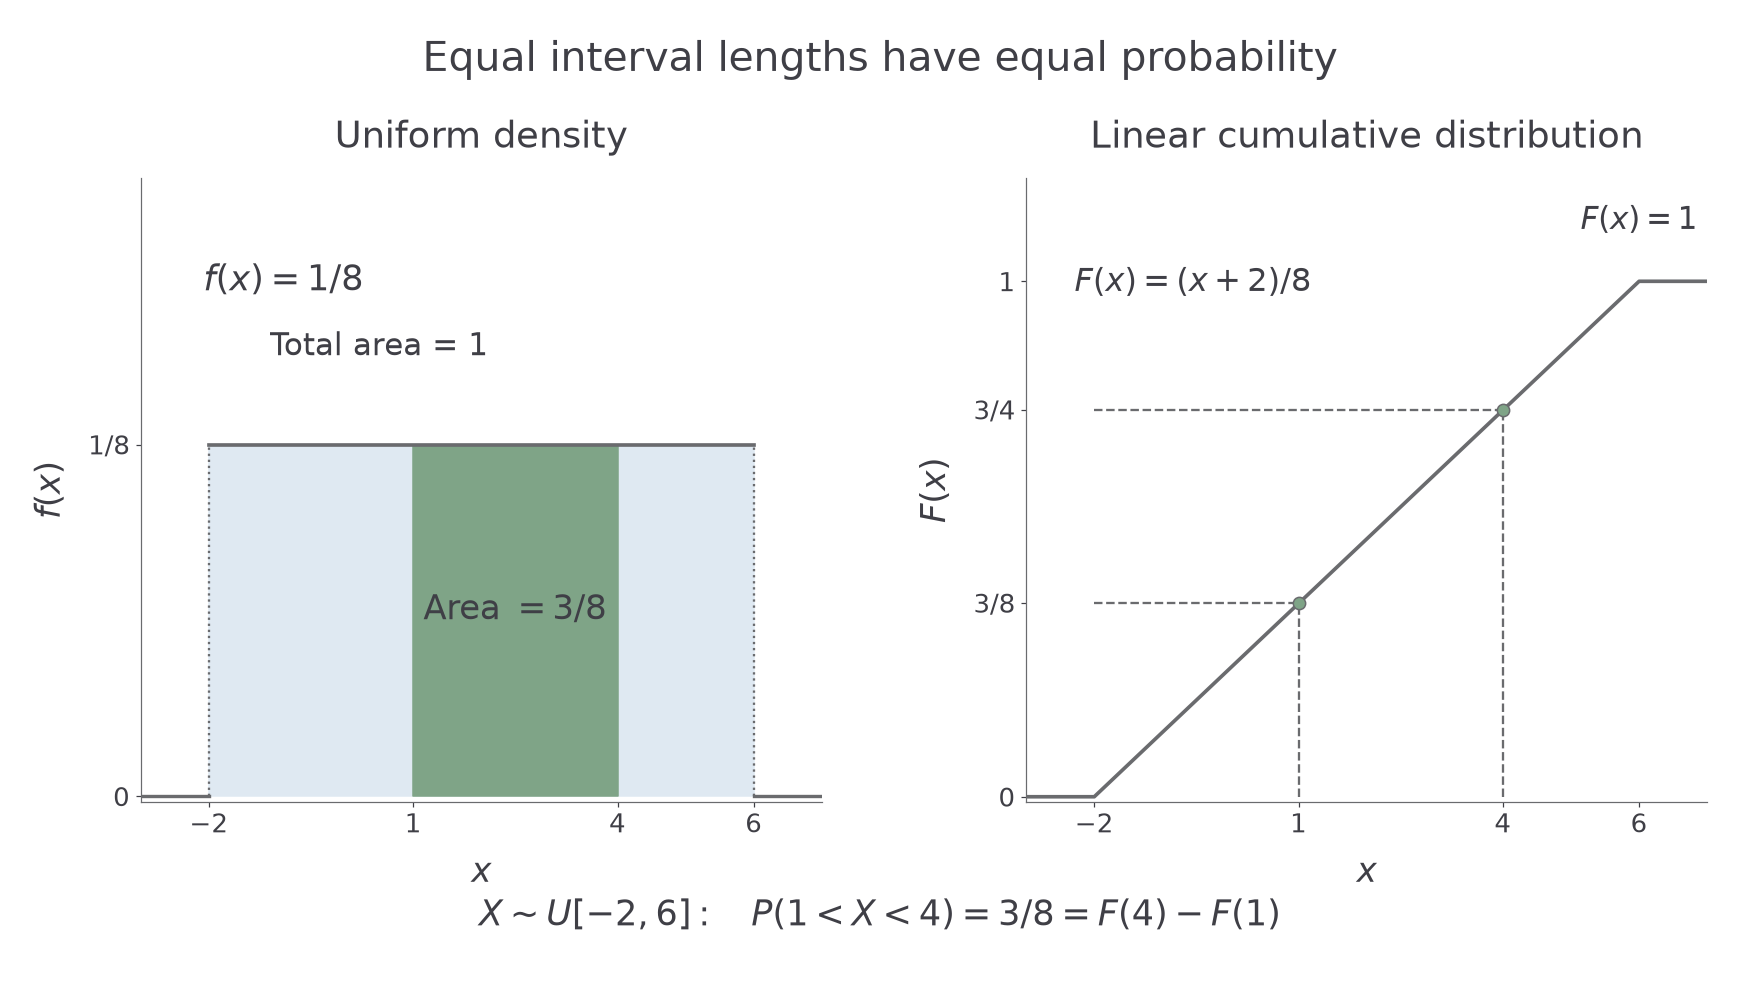
Worked example 1: a support crossing zero
Question. . Find its CDF and .
Plan. Use total width , integrate the constant density from , and compare interval lengths.
Why use ? The accumulated interval starts at , so its width is , rather than .
Answer.
Check. , , and .
Worked example 2 changes only the upper endpoint, stretching the same total probability over a longer interval.
Worked example 2: a wider support lowers the density
Question. Now . Find its CDF and .
Plan. Replace the total width by , keeping the same requested interval.
Why does the probability fall? The interval now occupies a smaller fraction of the support.
Answer. The CDF is below , on , and above ; the probability is .
Check. The rectangle area is , and .
A uniform model is appropriate only when constant density is credible over the stated interval. Knowing only the minimum and maximum does not establish uniformity.
Watch out
Wrong: divide by the upper endpoint . Right: divide by the width . For , the width is , not .
Stretch that upper endpoint again.
Derive the mean and variance before using them
The centre of a rectangle suggests its mean. Integration confirms that intuition and gives the spread as well.
For , the expectation integral gives
These derivations may be required, even though their final results are supplied.
Uniform mean and variance
For , with ,
In the formula booklet.
The mean determines the midpoint; the variance determines the width. Moving the whole interval changes the mean but leaves the variance unchanged. Multiplying its width by a factor multiplies its variance by that factor squared.
Worked example 3: recover the two endpoints
Question. A uniform variable has mean and variance . Find its support .
Plan. Find the midpoint and positive width, then move half that width either side of the midpoint.
Why choose the positive root? By definition , so is a width, not a signed displacement.
Answer. The support is .
Check. Its midpoint is , and its variance is .
Worked example 4 changes only the variance. The midpoint stays at .
Worked example 4: four times the variance
Question. A uniform variable has mean and variance . Find its support.
Plan. Find the new positive width from the variance, keeping the same midpoint.
Why does the width only double? Variance depends on width squared, so multiplying variance by multiplies width by .
Answer. The support is .
Check. The midpoint is , and .
The CDF also shows that the midpoint cuts the area in half. More generally, the cut leaving probability to the left is , obtained by solving . This percentile expression is derived, rather than printed separately in the booklet. The flat density has no unique modal peak.
Watch out
Wrong: . Right: square the width. Also distinguish variance from standard deviation when recovering the endpoints.
Continue this lesson.
You’re previewing NovaLearn without an account. Create a free account to read the rest.
Create free account