CP 5.3 - Mean value of a function
The mean value of a function is its average height across an interval. You will calculate it using an integral, interpret positive and negative contributions, and use a stated mean to find an unknown constant.
An average across a whole interval
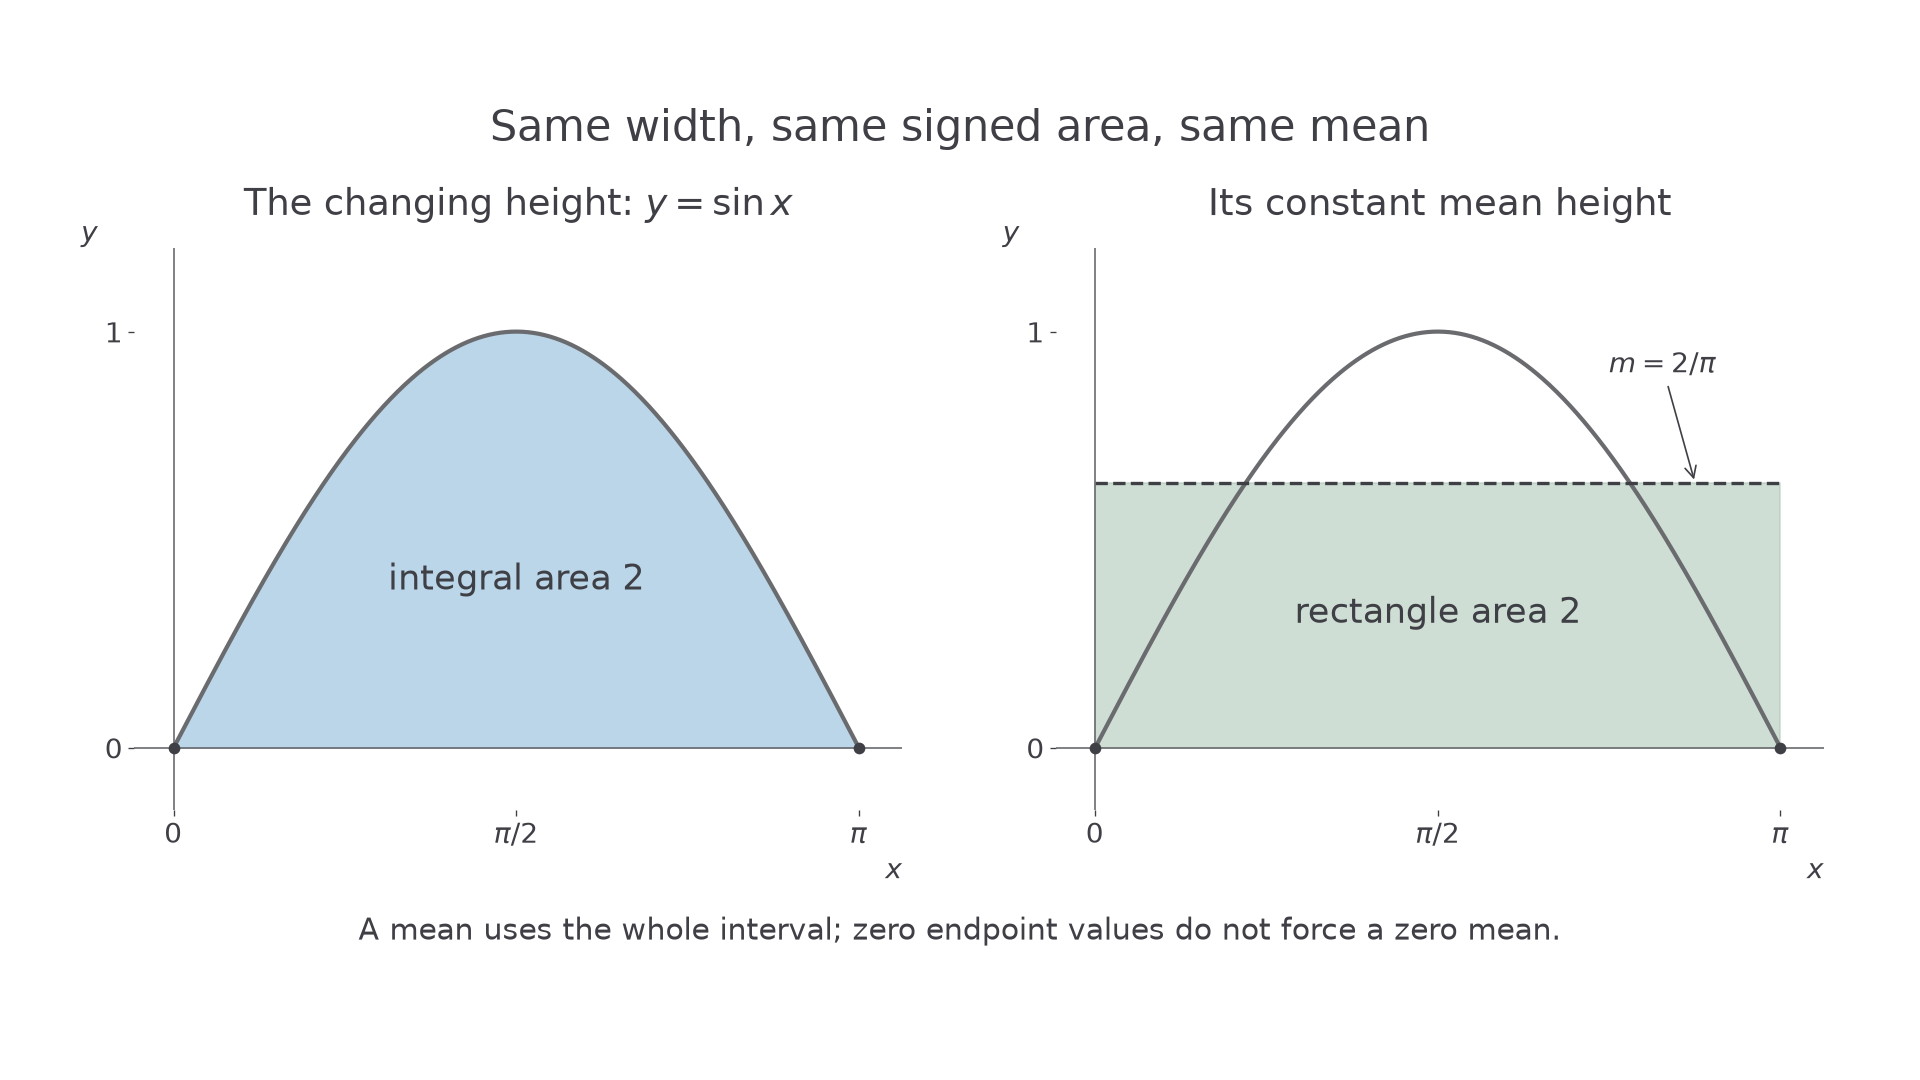
At both ends of the interval , the function has value zero. Is its average value therefore zero? The graph is positive everywhere between those endpoints, so averaging just the endpoints has missed almost everything happening in between.
You already know
A definite integral gives signed area: regions above the horizontal axis contribute positively and regions below contribute negatively. If , then .
Imagine replacing a changing height by one constant height , over the same width . To keep the signed area unchanged, the rectangle must satisfy . Dividing by the width gives the mean.
[DIAGRAM: asset_name: Sine curve and its equal-area mean rectangle; asset_slug: 9fm0-cp53-mean-rectangle; caption: The half-wave and the rectangle have the same area 2 over the same width pi; description: Two coordinate panels run from x=0 to x=pi. The first shades the positive sine half-wave in pale blue and labels integral area 2. The second shows a pale sage rectangle of width pi and height 2/pi, with the sine curve as a thin comparison line. Both endpoints of the sine curve are marked at height zero.]
Mean value of a function
The mean value of an integrable function on a finite interval , where , is its integral divided by the interval's width. It averages the whole interval, rather than just selected function values.
The rectangle interpretation gives a formula you can use whether the graph stays above the axis or crosses it.
Mean value
For , with integrable on ,
Not in the formula booklet: learn it.
For a constant function , this gives , as it should. A negative mean is possible: it means the net signed area is negative. It does not mean an ordinary geometric area is negative. If the function is continuous, its mean lies between its minimum and maximum on the interval; that gives a useful check on your arithmetic.
Key idea
Mean value is signed area divided by width. The denominator is , not , and the integral is not automatically an unsigned area.
Use the width to interpret the data in this short check.
Calculating a mean from an antiderivative
Write the mean-value factor before integrating. It is easy to find the integral correctly and then forget the one operation that turns it into a mean.
For instance, is not linear, so its average height need not be the average of its endpoint heights. Integration measures how long the function spends at each height as you move across the interval.
Worked example 1: a polynomial mean
Question. Find the mean value of on .
Plan. Integrate between the endpoints, then divide by the width .
Why this step? The integral is , but that is spread across an interval of width . The required average height is .
Answer. The mean value is .
Check. The function ranges from to , and the mean lies between them. A rectangle of height and width has area .
Worked example 2 changes only the lower endpoint. Both the width and the evaluated integral must change.
Worked example 2: a non-zero lower endpoint
Question. Find the mean value of on .
Plan. Use width , evaluate the same antiderivative at both endpoints, then simplify.
Why subtract the lower value? The accumulated integral up to is outside the interval being averaged.
Answer. The mean value is .
Check. , and the mean is larger than in Worked example 1 because the low values on have been removed.
The average of the endpoint heights here is , which differs from . Endpoint averaging is exact for a straight-line graph, but is not a general mean-value method.
Watch out
Wrong: . Right: divide by . The width changes whenever either endpoint changes.
The next interval changes the upper endpoint instead.
Signed means and periodic functions
A mean describes the net contribution. For a wave that spends equal amounts above and below the axis, those contributions can cancel even though the function is rarely zero.
This distinction matters whenever a function changes sign. Integrating would instead give a mean magnitude, which is a different quantity. Use itself when asked for its mean value.
Worked example 3: the positive half-wave
Question. Determine the exact mean value of on .
Plan. Integrate the sine function and divide by the width .
Why this step? Although both endpoint heights are zero, the whole interior contributes positive area.
Answer. The mean is , approximately .
Check. . The mean rectangle has area , matching the half-wave.
Worked example 4 changes only the upper endpoint, extending the interval to a complete cycle. The new half-wave contributes negative signed area.
Worked example 4: a complete cycle
Question. Determine the mean value of on .
Plan. Integrate across the complete cycle, keeping the sign of each contribution.
Why this step? The second half-cycle has signed area , which cancels the first half-cycle's .
Answer. The mean is .
Check. Pair each point in the first half-cycle with : their function values are opposites, since .
The opening puzzle has a surprisingly substantial answer: zero at both ends, yet a mean of about two thirds of the maximum. A graph can tell you immediately why endpoint sampling is misleading, even before you integrate.
Watch out
Wrong: add the unsigned areas of both half-waves when finding the mean of . Right: retain the negative contribution below the axis. Mean value and mean magnitude are different questions.
An extra half-cycle changes the cancellation once more.
Using a known mean to find a constant
A stated mean gives an equation for an unknown constant. Form the mean correctly first; then solve the resulting algebraic equation.
For , the term contributes mean on any interval. The remaining mean depends on both and the interval. This provides a check on the algebra rather than another formula to memorise.
Worked example 5: a mean condition
Question. The mean value of on is . Determine .
Plan. Set the mean-value integral equal to , evaluate it in terms of , and solve.
Why this step? The mean is , so the integral itself must be , not .
Answer. .
Check. With , the integral is , and .
Worked example 6 changes only the lower endpoint. The required mean stays , so the coefficient must adapt.
Worked example 6: the same mean on another interval
Question. The mean value of on is . Determine .
Plan. Use width , evaluate both limits, and solve the new equation.
Why is smaller? Removing removes the lower values of , so a smaller coefficient achieves the same target mean.
Answer. .
Check. .
These examples also show why the interval is essential information. A function has a mean on a specified interval, not one universal mean independent of where you look.
Watch out
Wrong: use in Worked example 5. The stated is the mean height, not the integral over width . Right: , or equivalently set the integral equal to .
Once the width is included, the remaining equation is ordinary algebra.
Exam tip
For a “determine the constant” question, show the mean-value equation before solving it. The integral alone does not show that you have used the stated mean.
Use a different width in the final check.
Quick Recap
- The mean is : signed area divided by width.
- Evaluate both endpoints of the antiderivative and retain the mean-value factor.
- Negative contributions cancel positive contributions; mean value is different from mean magnitude.
- A stated mean can be used as an equation for a constant.
The mean of on is , even though both endpoint values are zero.