FS1 4.2 - Testing a geometric parameter
A long wait for success can challenge a claimed success probability. You will test the population parameter of a geometric distribution, choose the correct tail, construct integer critical regions and check their actual significance levels (FS1 4.2).
A longer wait points to a smaller probability
A spinner is supposed to land on red with probability . You spin independently until the first red, which arrives on spin . Is this enough evidence, at the level, that the probability of red is lower than claimed?
Here a large observation supports a small parameter. That reverses the relationship in a Poisson mean test: reducing a geometric success probability makes long waits more likely.
You already know
If , counts all trials up to and including the first success, so . For , and . The probability formula is supplied in the booklet; these tail forms are derived, not printed.
Define as the population probability of red on each spin. For the opening claim, write , , and use under . The observation is a trial number, not an estimate to insert into the hypotheses.
| Claim | Alternative | Evidence supporting it | One-sided tail under the null |
|---|---|---|---|
| Success has become less likely | A long wait | ||
| Success has become more likely | A short wait | ||
| The probability has changed | Either extreme | Both tails |
The trials must be independent with the same success probability. “Success” is simply the named event; it may be a fault, a six or a fault-free run. Repeated sampling without replacement or a player improving with practice can break the model. Do not change the stopping rule to a fixed number of trials: that creates a different experiment.
A useful warning comes from . Every individual geometric probability is at most , since . A supposed test that rejected whenever an individual outcome had probability below would reject on every possible result, even when ! Extremeness requires a tail, not just a small point probability.
Key idea
Choose the alternative from the claim, then choose the tail from the waiting-time meaning: small goes with large . A non-significant result gives insufficient evidence for the alternative; it does not establish that .
Keep the population parameter and the observed waiting time separate in this check.
Testing an observed first-success trial
Calculate the inclusive tail under , compare it with the stated level, and give a contextual conclusion about the population probability.
One-sided geometric tests
For under , where , an observed trial gives
Reject if the relevant probability is at most the stated significance level .
Not in the formula booklet: learn it.
For a long-wait test, reaching trial requires failures on the first trials. It does not require success exactly at ; later successes count as at least as extreme too.
[DIAGRAM: asset_name: The geometric test tail includes later successes; asset_slug: 9fm0-fs109-geometric-test-tail; caption: First success on trial fourteen is tested using thirteen initial failures and every later possible success; description: A timeline shows thirteen pale blue F cells followed by a sage S cell on trial fourteen, labelled as the observed outcome. A bracket under the first thirteen cells identifies the failures needed for the event X at least fourteen. The upper-tail probability is 0.8 to the power thirteen, approximately 0.05498. Text states that the test tail also includes first successes on trials fifteen, sixteen and all later trials, and that multiplying by 0.2 would instead give the point probability for exactly fourteen.]
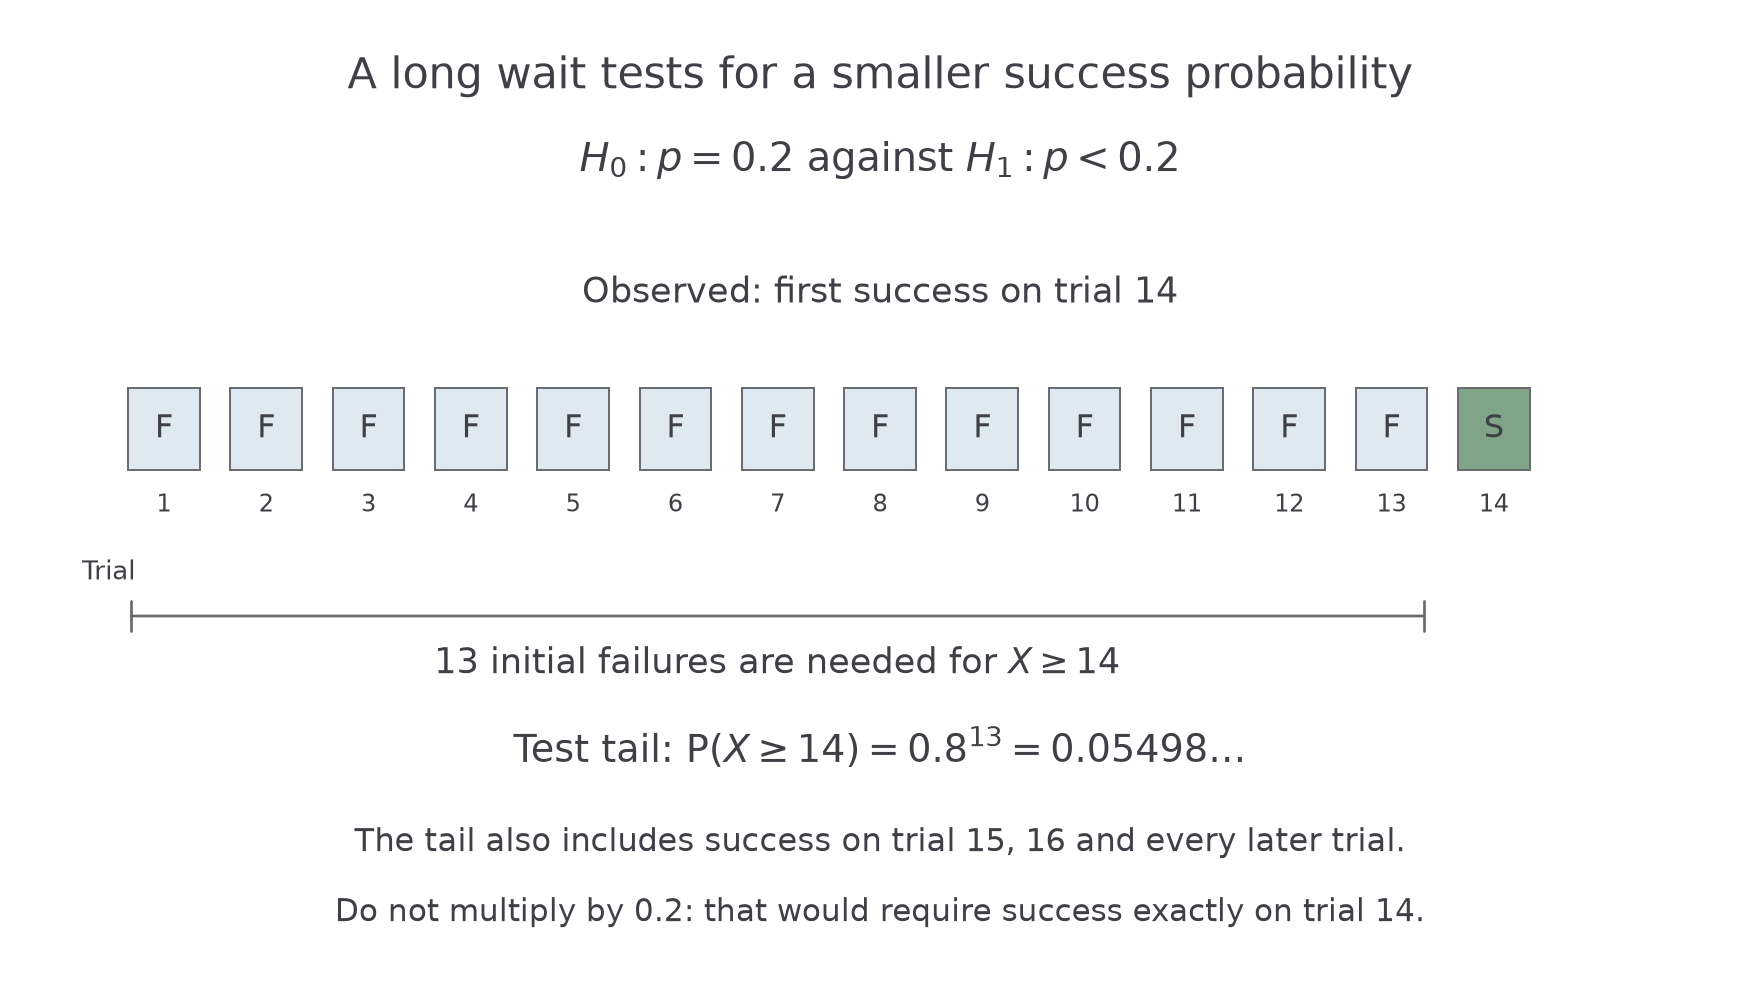
Worked example 1: fourteen trials are not quite enough
Question. A spinner has population probability of red on each independent spin. The first red occurs on spin . Test against at the level.
Plan. A long wait supports the alternative, so use the upper geometric tail under .
Why this step? would count only one stopping trial. It omits every longer wait, even though longer waits support a reduction still more strongly.
Answer. Do not reject . At the level there is insufficient evidence that the population probability of red is less than .
Check. The point probability is only , but the correct tail is larger. The decision must use , without rounding it prematurely to .
Worked example 2 changes only the observed first-red trial, from to . All test choices stay fixed.
Worked example 2: one extra failure changes the decision
Question. Carry out the same test if the first red occurs on spin .
Plan. Include all waits of at least under the same null model.
Why this step? One extra required failure multiplies the preceding tail by , taking it below the boundary.
Answer. Reject . There is sufficient evidence, at the level, that the population probability of red is below .
Check. The adjacent tails straddle , so this test's critical region is . Its actual significance is , not exactly .
For the opposite alternative , the lower-tail probability starts at . If , even an immediate success has lower-tail probability . No non-empty short-wait critical region is possible for a one-observation test of that increase. This is a limitation of the experiment, not an arithmetic error.
Continue this lesson.
You’re previewing NovaLearn without an account. Create a free account to read the rest.
Create free account