6.3.2(b) - Predator-prey relationships and competition
Populations do not change in isolation. In the same ecosystem, one population may become food for another, or two populations may put pressure on the same limited resource. In this lesson, you will learn how predator-prey relationships affect both populations, and how to distinguish interspecific competition from intraspecific competition.
Population Interactions
A population is a group of organisms of the same species living in the same area at the same time. A population interaction is a way in which one population affects another population, usually by changing survival, reproduction, or the rate at which population size changes.
In this lesson, there are two main interaction types:
| Interaction | Basic meaning | Population effect to look for |
|---|---|---|
| predator-prey relationship | one species, the predator, kills and eats individuals of another species, the prey | predator numbers depend partly on food supply; prey numbers are affected by predation |
| competition | organisms require the same limited resource | survival, reproduction or population growth can decrease because the resource is harder to obtain |
Predator
A predator is an organism that kills and eats another organism.
Prey
Prey are organisms killed and eaten by predators.
The word "relationship" matters. A predator-prey relationship is not only one animal catching one meal. It is a population-level interaction: if prey become more abundant, predators may have more food, so more predators may survive and reproduce. If predators become more abundant, more prey may be killed, so the prey population may decrease.
Competition also works at population level. When organisms compete for a limited resource, some individuals obtain less of that resource. That can reduce growth, survival or reproduction, which can slow the increase of a population or cause it to decrease.
A change can spread through a food web. If a seabird that eats small fish declines, its fish prey may increase and competing fish-eating birds may obtain more food. Gulls that eat the seabird may decline or switch to other prey, increasing pressure on those alternatives. More fish can increase competition within the fish population. The direction and timescale depend on alternative food and other limiting factors.
Over many generations, predation also acts as a selection pressure. Individuals with heritable traits that help them avoid predators are more likely to survive and reproduce; advantageous alleles can become more common. This evolutionary effect is distinct from the short-term rise and fall of population numbers.
Predator-Prey Cycles
Predator and prey populations often show linked changes over time. The simplest pattern is a cycle with a time lag: the prey population changes first, then the predator population responds later.
Think through the sequence slowly.
- If prey numbers increase, predators have more food available.
- More food can increase predator survival and reproduction.
- Predator numbers then increase after a delay.
- More predators kill more prey, so prey numbers decrease.
- With fewer prey available, predators find less food.
- Predator numbers then decrease after another delay.
- With fewer predators, prey mortality from predation falls, so prey numbers may rise again.
This is a feedback loop, not a perfect clock. The predator population usually lags behind the prey population because predators need time to feed, survive, reproduce and add offspring to the population.
[DIAGRAM: predator_prey_cycle_graph: Lesson 170: Predator-prey relationships and competition - diagram 01; asset_slug: 170_m06_3_2_predator_prey_relationships_and_competition__diagram_01; recommended_method: matplotlib; description: A clean 16:9 line graph of relative population size against time, with the prey curve peaking before the predator curve, both curves labelled, and small callouts showing more prey supports predator increase and more predators increases prey mortality.]
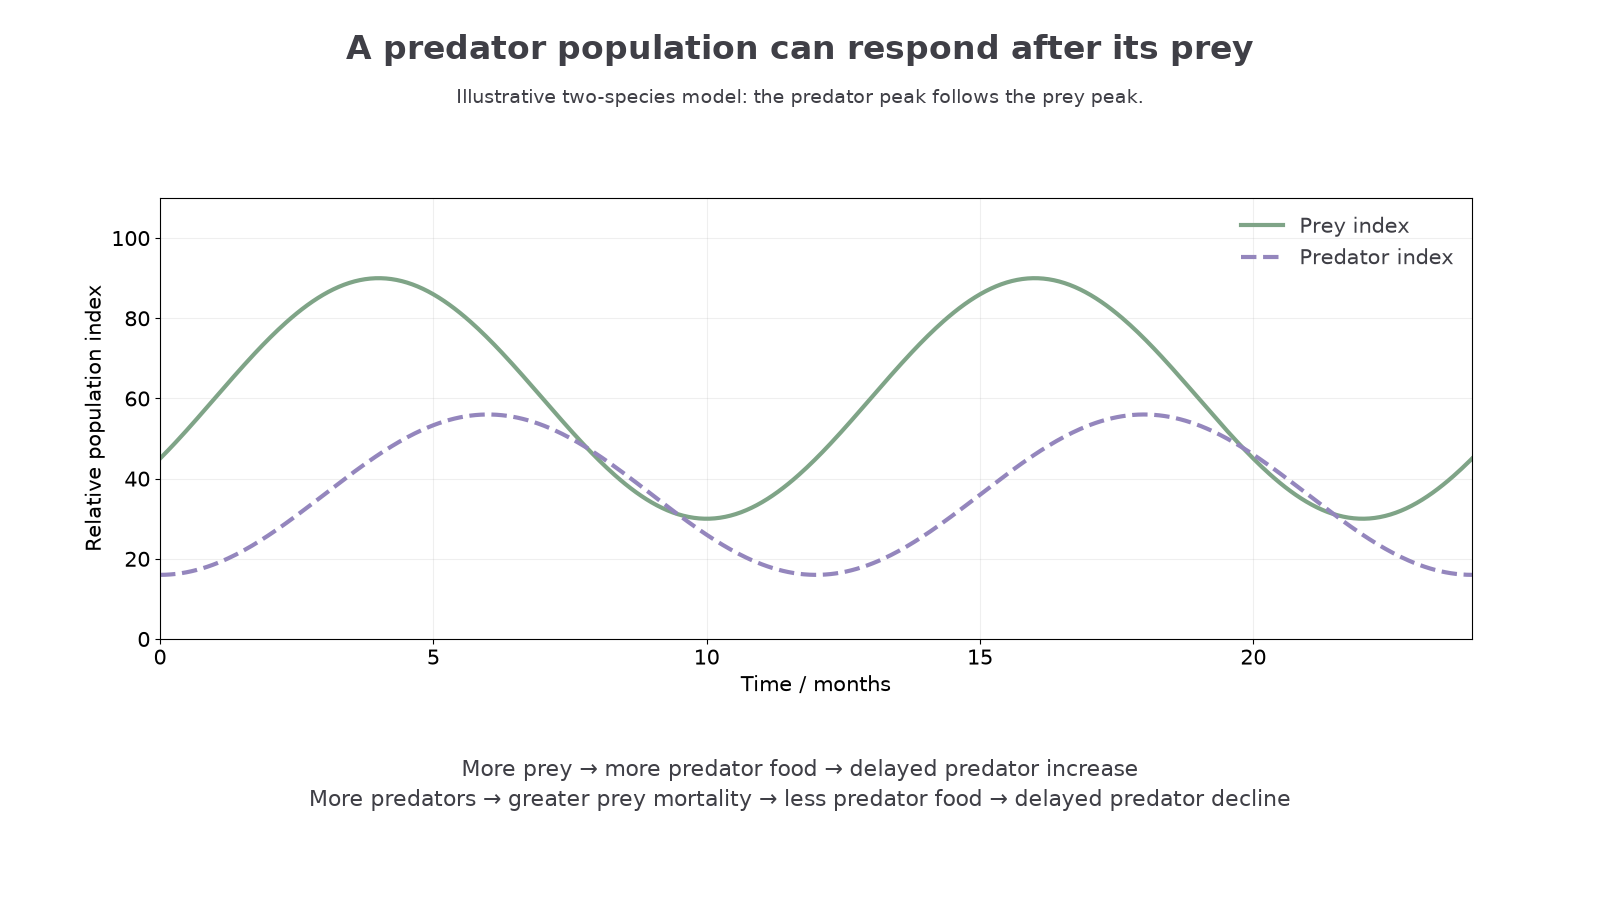
In this simplified cycle, the prey curve peaks before the predator curve. A common mistake is to say "predators increase, therefore prey increase". The first part is usually the other way round: an increase in prey can provide the food supply that allows predator numbers to increase. Later, the larger predator population contributes to a fall in prey numbers.
Reading a predator-prey trend
A student observes this pattern in a pond:
- Month 1: many water fleas, few predatory larvae.
- Month 2: water fleas reach a high number.
- Month 3: predatory larvae reach a high number.
- Month 4: water fleas are much less abundant.
A good explanation is: water flea numbers rise first, so predatory larvae have more food. More larvae survive and reproduce, so their population rises after a delay. The higher number of predatory larvae then increases predation on water fleas, so the water flea population falls.
When explaining a predator-prey graph, state which population changes first, then link the change to food availability or predation pressure. Do not just describe that both lines go up and down.
Real food webs contain alternative prey, competing predators and refuges where prey escape capture. Weather, disease, migration and seasonal breeding also change numbers. The two-species cycle is therefore a model, useful for identifying feedback and delays but not a prediction that every wild population follows equally spaced peaks.
Continue this lesson.
You’re previewing NovaLearn without an account. Create a free account to read the rest.
Create free account