6.3.1(e)(i)-(ii) - Distribution, abundance and ecosystem sampling
Ecologists often need to find out where organisms live and how common they are without counting every individual in the ecosystem. In this lesson, you will learn how distribution and abundance can be measured using sampling, how to choose a method that fits the organism and habitat, and how to record and process field data carefully enough for a valid conclusion.
What Is Being Measured
Before choosing any equipment, an ecologist has to be clear about the question. Two words do a lot of work in this topic.
Distribution
Distribution is where organisms are found within an ecosystem or habitat.
Once the position pattern has been described, the next question is how common the organism is in the places sampled.
Abundance
Abundance is how many organisms are present, or how common a species is, in a defined area or sample.
Distribution and abundance are linked but not the same. A lichen may be found only on the shaded side of tree trunks; that describes its distribution. If the shaded side has many small patches of that lichen in each quadrat, that describes its abundance.
In real ecosystems, both are usually estimates. A meadow, rocky shore, wall, woodland edge or stream is too large and uneven to measure completely. Sampling means collecting data from selected parts of the ecosystem and using those data as evidence for the wider area.
The strength of the estimate depends on the method. A good sampling method should:
| Requirement | Why it matters |
|---|---|
| match the organism | plants, lichens and mobile invertebrates cannot all be sampled in exactly the same way |
| reduce bias | the student should not choose only the most obvious, accessible or organism-rich places |
| use equal sampling effort | two sites can be compared only if the same amount of searching or trapping is done |
| record data clearly | tables, graphs and statistical tests depend on clear headings, units and sample identities |
When a question asks about improving a sampling method, link the change to the reason. "Use more quadrats" is stronger when followed by "so the sample is more representative of the habitat".
This lesson is about measuring distribution and abundance. Calculating a biodiversity index, explaining succession, and explaining population carrying capacity belong to neighbouring lessons.
Random Quadrats And Abundance Measures
A quadrat is a frame that marks out a known area. Quadrats are most useful for plants, lichens, algae on a surface, and organisms that are sessile or move slowly enough to be counted fairly.
Random quadrat sampling is used when the study area is fairly uniform, or when the aim is to estimate abundance without personal choice bias. A typical method is:
- Mark out the study area using tapes or a coordinate grid.
- Use a random number generator or random number table to choose coordinates.
- Place the same size quadrat at each coordinate using the same corner rule each time.
- Identify the target species and record the chosen abundance measure.
- Repeat for enough quadrats to make the estimate more representative.
[DIAGRAM: distribution_sampling_designs: Lesson 168: Distribution, abundance and ecosystem sampling - diagram 01; asset_slug: 168_m06_3_1_distribution_abundance_and_ecosystem_sampling__diagram_01; recommended_method: drawn_biology; description: A 16:9 deterministic line diagram comparing random quadrat coordinates in a uniform habitat with an interrupted belt transect across an environmental gradient, with labels for equal quadrat size, fixed intervals and reduced choice bias.]
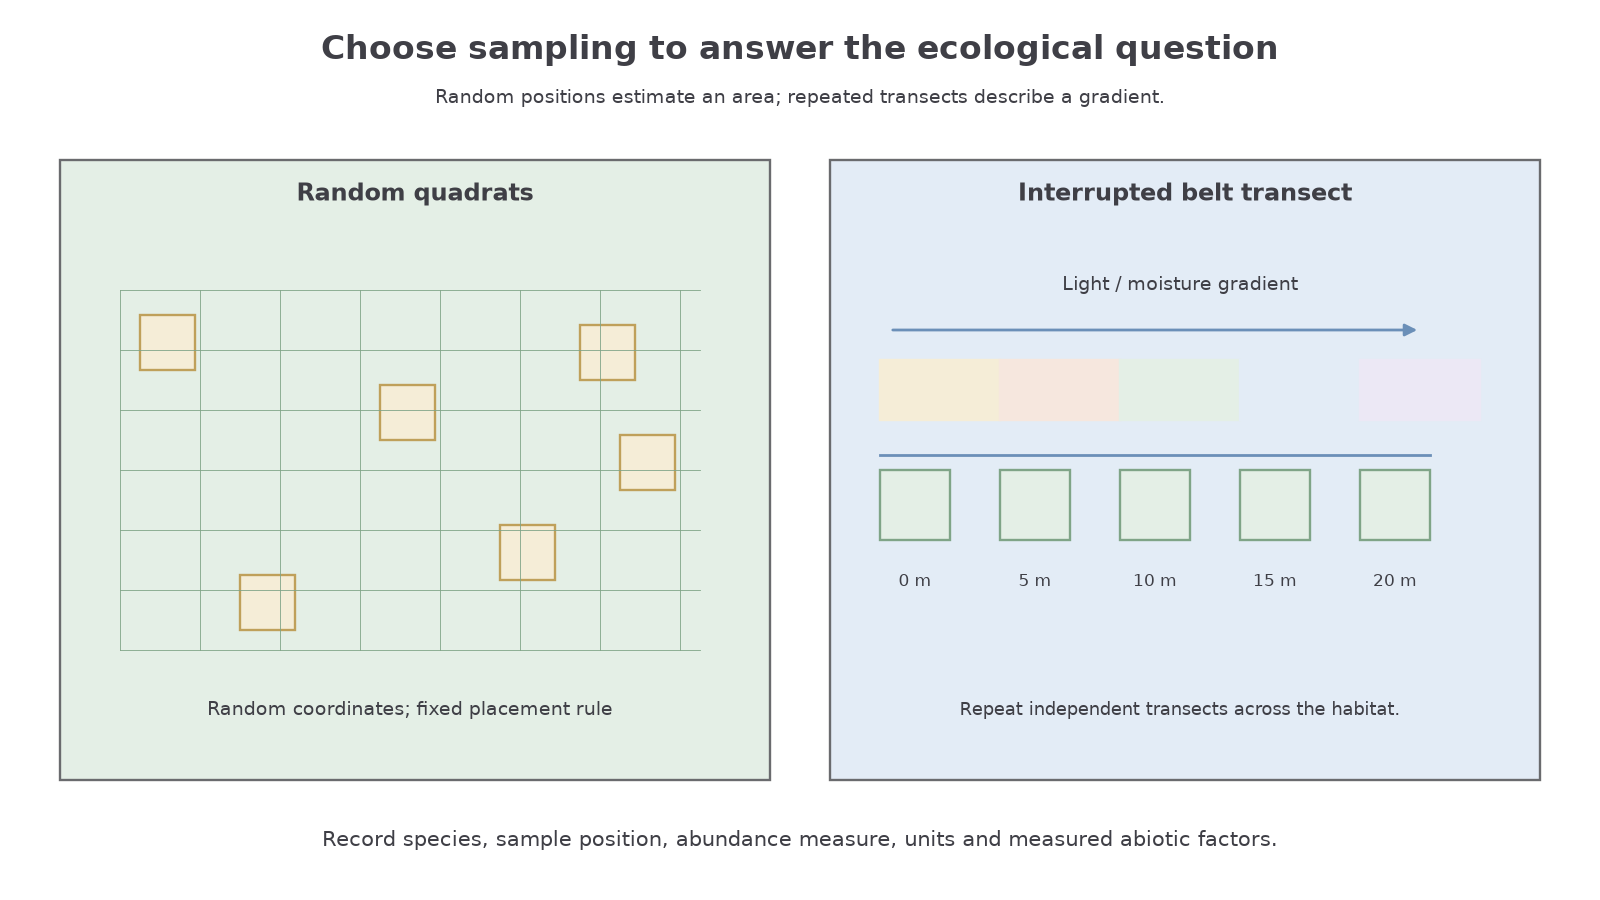
The abundance measure must fit the organism. Counting individual daisy plants may work if individuals are separate. Counting individual grass plants or creeping clover shoots may be much harder, so frequency or percentage cover may be more useful.
| Measure | How it is recorded | When it is useful |
|---|---|---|
| density | number of individuals per unit area | separate individuals can be counted reliably |
| frequency | percentage of quadrats in which the species is present | individuals are hard to separate but presence/absence is clear |
| percentage cover | estimated percentage of the quadrat covered by the species | plants form mats, patches or overlapping cover |
| local frequency | number of grid squares or point-quadrat hits occupied by the species | a gridded or point quadrat is used |
Density
If individual organisms are difficult to separate, a presence/absence measure can be more reliable than trying to count every shoot or patch.
Percentage Frequency
The formulas are simple, but the biological decision is important. Frequency can hide how much of a quadrat is covered, while percentage cover is faster but more subjective. Density can be precise for separate organisms but misleading if it is unclear where one individual ends and another begins.
Estimating abundance from random quadrats
A student samples twelve 0.25 m² quadrats in a grassland. Daisy plants are counted in each quadrat. The total number counted is 45, and daisies are present in 9 of the 12 quadrats.
Total area sampled = 12 × 0.25 = 3.00 m²
Density = 45 / 3.00 = 15 daisies m⁻²
Percentage frequency = (9 / 12) × 100 = 75%
The density estimates how many daisy plants occur per square metre. The frequency shows that daisies are widely distributed across the sampled area.
Throwing a quadrat is not a proper random method because the thrower still influences where it lands. Random coordinates are better because each coordinate has an equal chance of being selected.
Choose coordinates across the whole defined sampling area, using a random-number generator and a fixed rule for placing the quadrat at each coordinate. Do not move a selected quadrat to a patch that looks more interesting. If distinct habitat zones occupy unequal areas, stratified sampling with sample numbers proportional to each zone's area can improve representation. Record inaccessible coordinates and the replacement rule rather than silently excluding difficult habitat.
A sample estimates the population rather than counting every organism. More independent quadrats usually reduce sampling uncertainty, but many adjacent quadrats within one small patch do not represent a whole field. Use a pilot study to check whether additional samples materially change the mean and its uncertainty. A 0.5 m × 0.5 m quadrat has area 0.25 m², not 0.5 m².
Transects Across Gradients
Random quadrats are not always the best choice. If the question is about how distribution changes across a gradient, systematic sampling is more useful. A gradient is a gradual change in an environmental factor, such as distance from the sea on a rocky shore, light intensity from a woodland edge into woodland, or soil moisture across a field.
A line transect is a tape or rope placed in a straight line across the habitat. The simplest version records which species touch the line. A belt transect records organisms in quadrats placed along the line, so it gives abundance data as well as presence or absence.
In an interrupted belt transect, quadrats are placed at regular intervals, such as every 2 m or every 5 m. This is realistic when the transect is too long for continuous sampling. At each station, the student should use the same quadrat size, the same abundance measure, and ideally repeat quadrats near the station so that one patch does not dominate the result.
The method is systematic rather than random. That is not a flaw if the biological question is "How does abundance change with distance?" It would be a flaw if the student claimed it gave an unbiased estimate of the whole habitat without considering the direction of the transect.
Use random quadrats to estimate abundance in a fairly uniform area. Use a transect when the aim is to measure distribution and abundance along an environmental gradient.
Good transect records include distance along the transect, species name, abundance measure, units where needed, and any relevant abiotic factor. For example, a rocky shore record might include distance from the low-water mark and percentage cover of a seaweed species. A woodland-edge record might include distance from the edge and percentage cover of moss.
Mobile And Hard-To-Count Organisms
Quadrats are not enough for every ecosystem. A fieldwork method must fit the organism's behaviour and the habitat.
| Organism or habitat context | Suitable method | Key recording rule |
|---|---|---|
| plants, lichens or moss on a surface | frame quadrat, gridded quadrat or point quadrat | same quadrat size and same abundance measure |
| invertebrates in long grass or low vegetation | sweep netting | same number of sweeps or same sweeping time |
| active ground invertebrates | pitfall traps | same trap size, number of traps and trapping duration |
| invertebrates dislodged from shrubs or branches | beating tray plus pooter | same beating time or same number of branches |
| stream invertebrates | kick sampling with a net | same kick duration and same net position rule |
| mobile animals in a defined area | capture, mark, release and recapture | marking must not harm the animal or affect recapture chance |
Equal sampling effort is essential. If one site is sampled with ten traps overnight and another with two traps for one hour, the catches cannot be compared fairly. The difference could be caused by the method, not by the ecosystem.
Capture, mark, release and recapture can estimate abundance for suitable mobile animals. Animals are captured, marked harmlessly, returned and allowed to mix, then a second sample is taken. The proportion of marked animals in the second sample gives evidence about abundance. The assumptions matter: the mark should not rub off, marking should not affect survival or recapture, and the population should not change greatly between samples. OCR's practical focus here is the sampling method and its limitations, not recall of a named population-estimate formula.
Ethics also matter. Animals should be handled gently, kept in suitable conditions if temporarily removed, returned as soon as possible, and not left in traps in a way that increases stress, predation or death.
For capture–mark–release–recapture, mark harmlessly, release at the capture site and allow mixing. If 40 animals are marked initially and 10 of a second sample of 50 are marked, the marked fraction is estimated as 10/50. Assuming this represents the whole population, 40/N = 10/50, giving N = 200 animals. This estimate depends on a closed population during sampling, marks being retained and recognised, marked animals mixing, and marking not changing survival or capture probability. Loss of marks reduces recognised recaptures and can overestimate population size. Pitfall counts, in contrast, depend on movement and trap exposure as well as abundance; standardise trap size, opening and sampling duration, and check frequently to minimise harm.
Processing Sampling Data
Field data become useful when they are recorded in a form that can be checked, summarised and interpreted. A clear fieldwork table might include:
Continue this lesson.
You’re previewing NovaLearn without an account. Create a free account to read the rest.
Create free account