2.1.5(e)(i)-(ii) - Osmosis, water potential and practicals
Osmosis is how water moves across cell membranes when there is a difference in water potential. In this lesson you will learn how that gradient affects animal and plant cells, then use the same idea to design and interpret PAG8-style investigations with potato tissue or model cells. The important thread is precision: water potential decides the direction of net water movement, and practical evidence must be processed before it can support a conclusion.
Water potential gradient
Water molecules are in constant random motion. If a membrane lets water through but restricts many solutes, water can cross the membrane even when the solute particles cannot. Osmosis is the net movement of water across a partially permeable membrane down a water potential gradient.
Osmosis
Osmosis is the net movement of water molecules across a partially permeable membrane from a region of higher water potential to a region of lower water potential.
Water potential is a measure of the tendency of water to move. At the same temperature and reference pressure, pure water has water potential 0 kPa and a solution has a lower value. Pressure also contributes to total water potential; increasing turgor pressure raises a plant cell's water potential until net entry can stop. Adding dissolved solutes lowers water potential, making it more negative. So water moves from a less negative, higher water potential to a more negative, lower water potential.
That is why the phrase "down a water potential gradient" is safer than "towards the most concentrated solution". A concentrated solution usually has lower water potential, but OCR answers should make the water-potential direction explicit.
[DIAGRAM: water_potential_gradient_and_cell_effects: Lesson 044: Osmosis, water potential and practical investigations - diagram 01; asset_slug: 044_m02_1_5_osmosis_water_potential_and_practical_investigations__diagram_01; recommended_method: drawn_biology; description: 16:9 deterministic schematic showing water potential gradient, net osmosis across a partially permeable membrane, and key animal/plant cell effects in a pale scientific palette.]
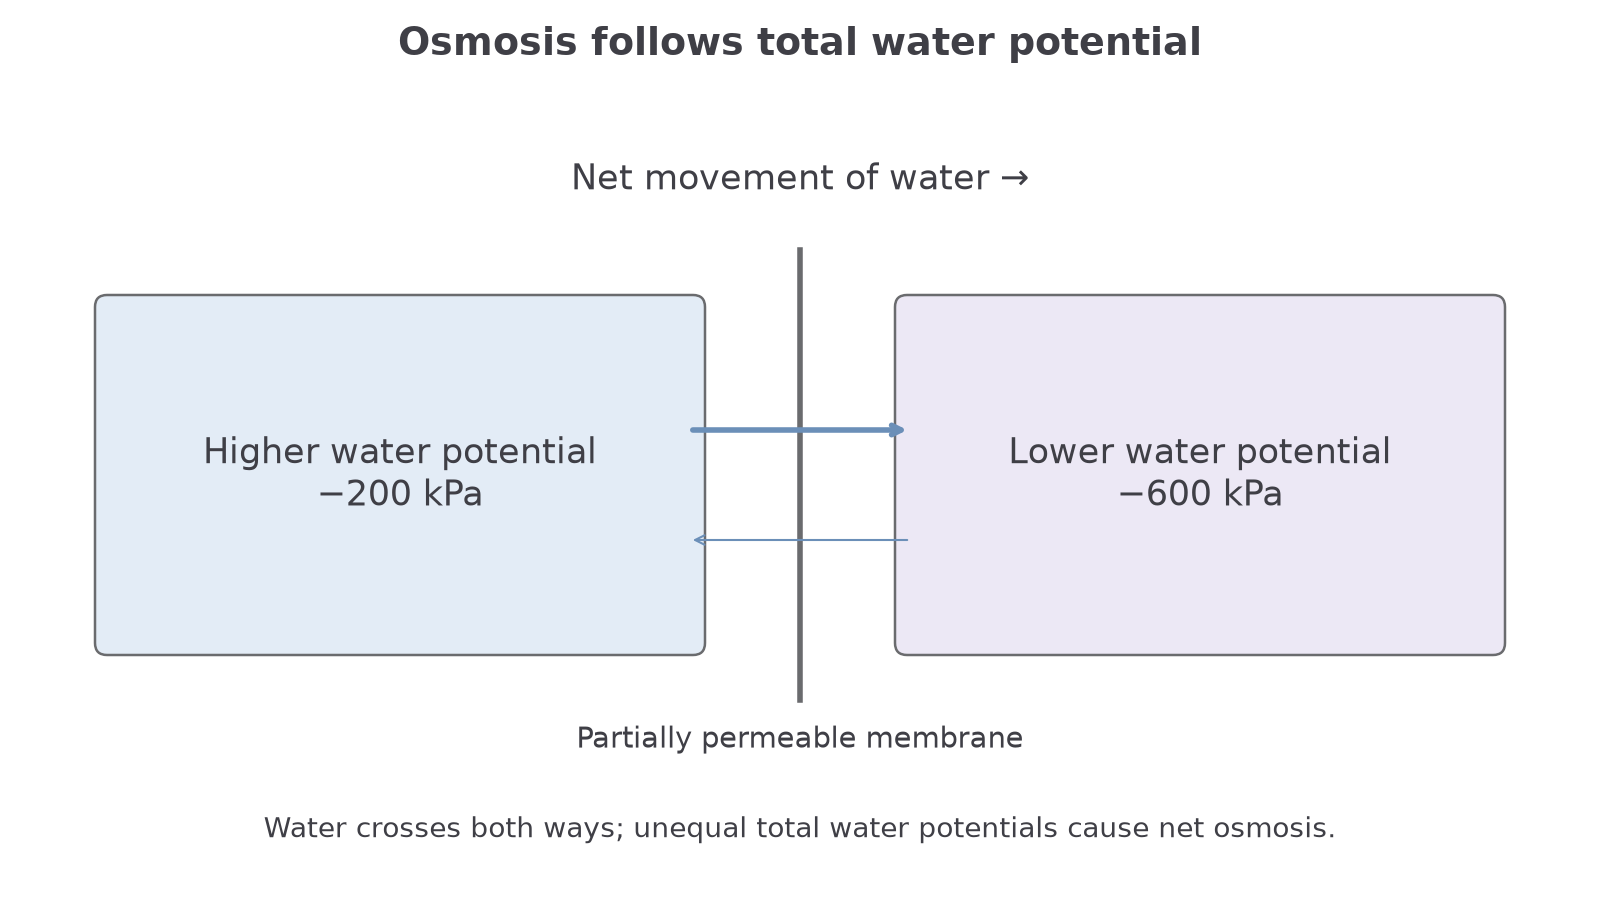
The diagram also shows a subtle point: water molecules move both ways across the membrane. Osmosis describes the net movement, meaning the overall direction after movement in both directions is considered. If water potentials are equal, there is no net movement of water, even though individual water molecules still cross.
Do not write that solute molecules "pull" water through the membrane as if osmosis is one-way suction. For full precision, state the membrane, the water potential gradient, and the direction of net water movement.
The next check is testing that full chain: membrane, gradient, and net direction.
Effects on cells
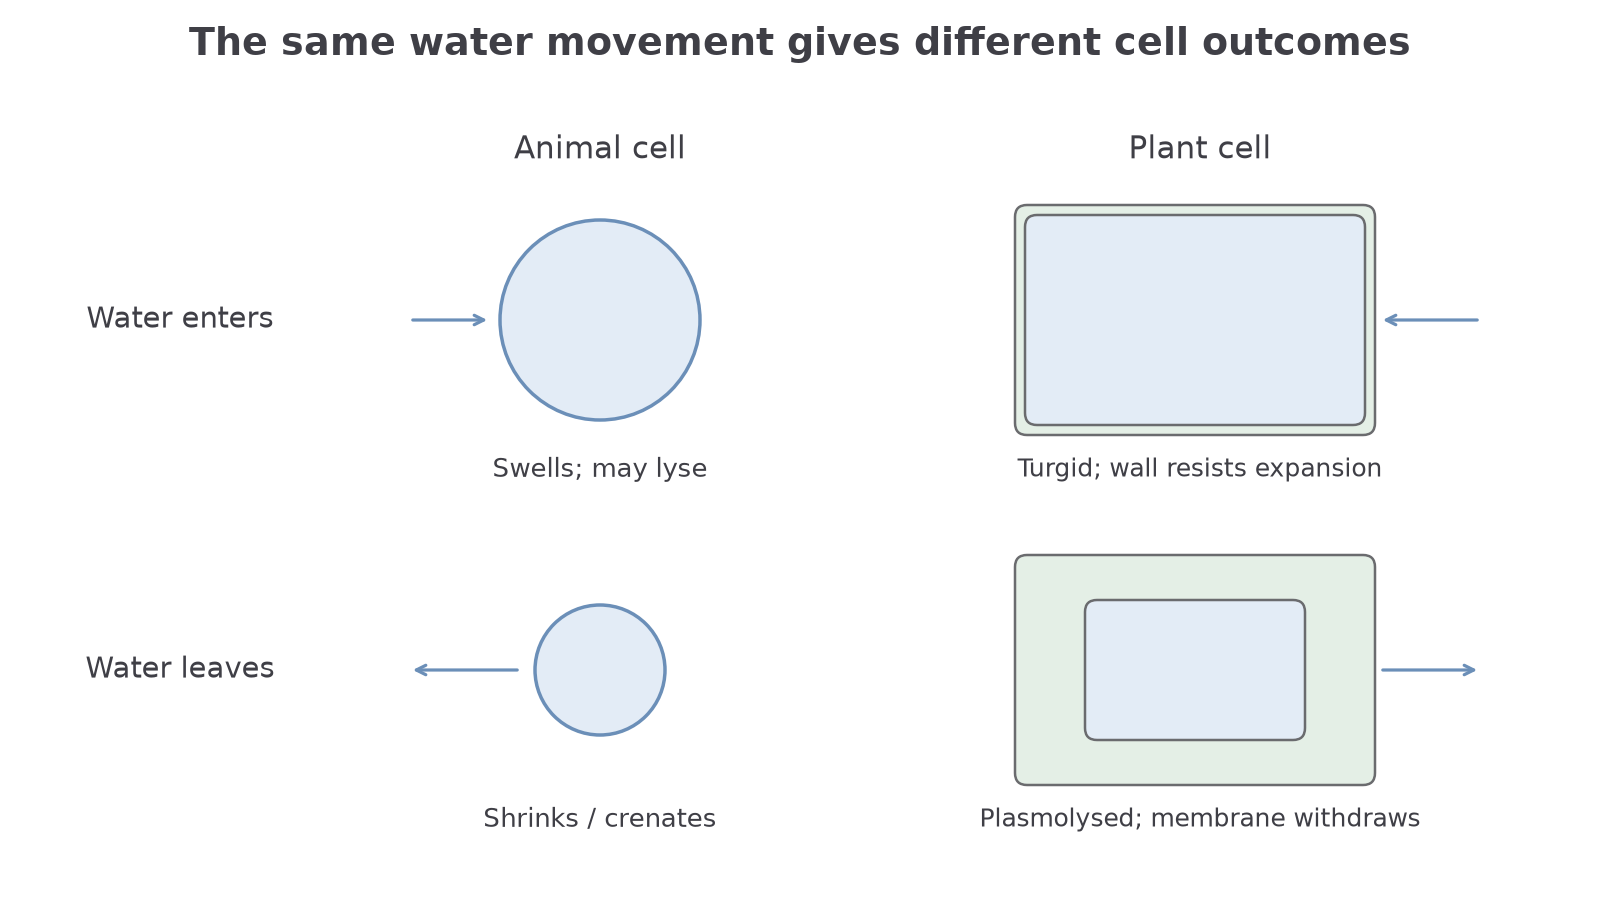
The same osmosis rule produces different visible effects in animal and plant cells because plant cells have a cell wall and large vacuole, while animal cells do not have a cell wall.
In an animal cell placed in a solution with higher water potential than the cytoplasm, water enters by osmosis. The cell swells and may burst, or lyse, if too much water enters. In a solution with lower water potential than the cytoplasm, water leaves by osmosis and the cell shrinks. For red blood cells, this shrinkage is often called crenation.
Plant cells behave differently because the cellulose cell wall resists expansion. If a plant cell is placed in a solution with higher water potential than the cell contents, water enters by osmosis and the vacuole expands. The cytoplasm presses against the cell wall and the cell becomes turgid. The cell wall stops the cell from bursting.
If a plant cell is placed in a solution with lower water potential than the cell contents, water leaves by osmosis. Turgor pressure falls, so the cell becomes flaccid. If water loss is severe, the cell surface membrane pulls away from the cell wall; this is plasmolysis.
| External solution compared with cell contents | Animal cell effect | Plant cell effect |
|---|---|---|
| Higher water potential | Water enters; cell swells and may lyse | Water enters; cell becomes turgid |
| Similar water potential | No net osmosis; size stays similar | No net osmosis; turgor does not greatly change |
| Lower water potential | Water leaves; cell shrinks or crenates | Water leaves; cell becomes flaccid or plasmolysed |
One common error is to call the cell wall partially permeable. The cell wall is freely permeable to water and many solutes. The partially permeable barrier is the cell surface membrane, and in plant cells the tonoplast around the vacuole is also important for water movement into and out of the vacuole.
For example, −300 kPa is higher than −700 kPa, so net water movement is towards the −700 kPa compartment if a suitable membrane separates them. In a turgid plant cell, pressure from the wall raises total water potential. Thus net entry eventually stops even though solute remains inside; equal total water potentials do not require equal solute concentrations.
[DIAGRAM: 044_cell_osmosis: Osmosis changes animal and plant cells differently.; asset_slug: 044_cell_osmosis; recommended_method: drawn_biology; description: Osmosis changes animal and plant cells differently.]
PAG8 investigation design
PAG8 investigates transport in and out of cells. For osmosis, the classic plant-cell method uses potato cylinders placed in sucrose solutions of different concentrations. A model-cell version can use dialysis tubing, sometimes called Visking tubing, filled with a solution and placed in other solutions. For an artificial osmotic model, the tubing must allow water through while retaining the chosen solute over the measurement interval. Many dialysis-tubing grades allow small solutes such as sucrose to pass: check the molecular-size cutoff and select an appropriate retained solute/tubing combination. If solute also diffuses, its changing gradient limits the comparison with a living cell.
If actual animal cells are used, the work must follow the teacher's approved source, hygiene and risk instructions. The biological outcome is still the same gradient idea: cells without a wall shrink in lower-water-potential solution and may lyse in higher-water-potential solution. In many school investigations, dialysis tubing is used instead because it models a partially permeable barrier without needing living animal cells.
[DIAGRAM: pag8_osmosis_investigation_workflow: Lesson 044: Osmosis, water potential and practical investigations - diagram 02; asset_slug: 044_m02_1_5_osmosis_water_potential_and_practical_investigations__diagram_02; recommended_method: drawn_biology; description: 16:9 deterministic PAG8 workflow showing potato cylinders, sucrose dilution range, balance/ruler measurements, controls and data-processing decisions in a pale scientific palette.]
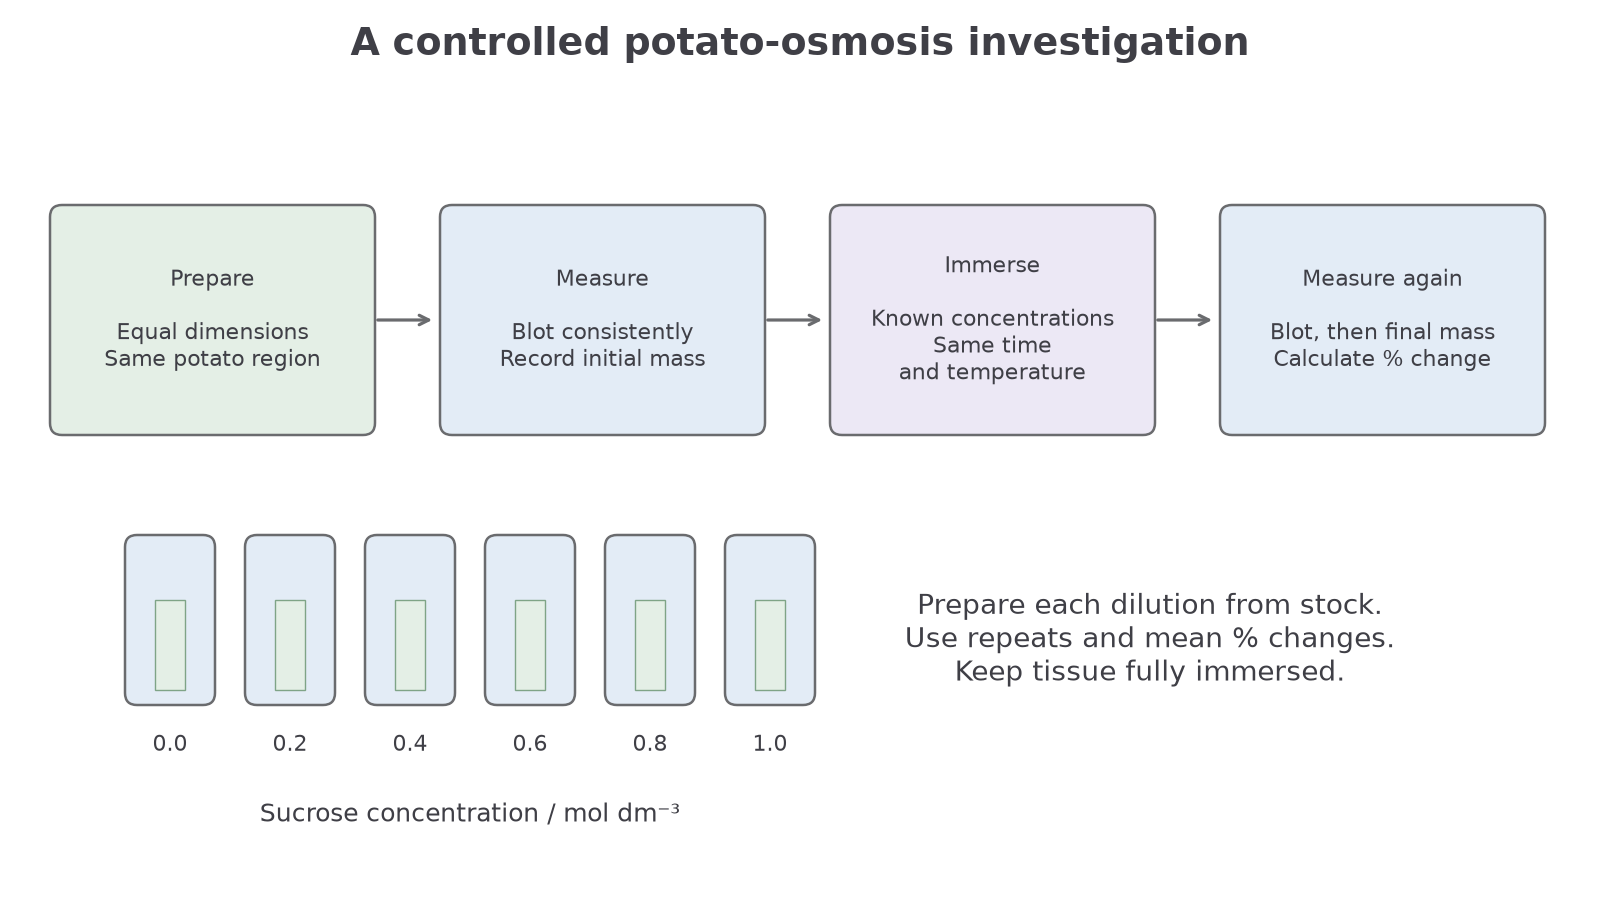
The independent variable is the water potential of the external solution. In practice, this is often changed by using different sucrose concentrations. The dependent variable is the effect on the cells or model cells, commonly measured as change in mass or change in length. Percentage change is usually better than raw change because starting masses or lengths may not be identical.
Percentage change
The control variables matter because anything that changes osmosis or tissue structure could distort the result. Suitable controls include:
| Control variable | Why it matters |
|---|---|
| Temperature | It affects kinetic energy of water molecules and may affect membrane permeability. |
| Potato variety, age or source | Different tissue samples may have different initial water potentials. |
| Cylinder diameter and length | Surface area and volume affect how quickly water moves and how much tissue is exposed. |
| Volume of solution | The tissue must be fully immersed so osmosis can occur over the whole exposed surface. |
| Time in solution | Longer time allows more water movement before measurement. |
| Blotting method | Surface solution left on tissue would change the measured mass. |
The following is a planned dilution series made independently from stock, not a serial dilution. Use : stock volume = target concentration × final volume / stock concentration. A serial dilution instead makes each new solution from the previous dilution. For example, to make 30.0 cm³ of each sucrose solution from 1.0 mol dm⁻³ stock:
| Final sucrose concentration / mol dm⁻³ | Volume of 1.0 mol dm⁻³ sucrose / cm³ | Volume of distilled water / cm³ |
|---|---|---|
| 1.0 | 30.0 | 0.0 |
| 0.8 | 24.0 | 6.0 |
| 0.6 | 18.0 | 12.0 |
| 0.4 | 12.0 | 18.0 |
| 0.2 | 6.0 | 24.0 |
| 0.0 | 0.0 | 30.0 |
Continue this lesson.
You’re previewing NovaLearn without an account. Create a free account to read the rest.
Create free account