4.2.1(b)(i)-(ii) - Sampling biodiversity in habitats
Sampling lets biologists make a reliable estimate of the organisms in a habitat without trying to count every individual. In this lesson, you will learn how random and non-random field sampling are used to measure biodiversity, how to choose equipment for different organisms, and how to make the method fair enough for the data to mean something.
Why Sampling Matters
A habitat is a place where organisms live, such as a meadow, woodland edge, rocky shore or stream bank. Biodiversity in a habitat depends on the range of organisms present and how they are distributed, but a habitat is usually too large, uneven and changeable for every organism to be counted.
Sampling solves that problem by studying a smaller part of the habitat and using it as evidence for the wider area. A good sample is not just a small sample; it is a sample collected in a way that represents the habitat fairly.
Sample
A sample is a selected part of a larger habitat or population that is studied to estimate features of the whole.
Sampling matters because organisms are rarely spread evenly. Some plants grow only in damp hollows, some invertebrates stay near shrubs, and some organisms are active only at particular times. If only the easiest patch is sampled, the result may say more about the student's choice of patch than about the habitat.
Good sampling therefore aims to:
| Aim | Why it matters |
|---|---|
| reduce bias | the person sampling should not choose only obvious, convenient or organism-rich places |
| cover the range of organisms | different microhabitats and organism types can contribute to biodiversity |
| allow comparison | two habitats can be compared only if sampling effort is similar |
| support data processing | counts, frequencies and abundance estimates can be organised in tables and graphs |
In method answers, do not just say "more accurate". Link the improvement to a reason, such as "more representative because it samples each area of the habitat".
This lesson focuses on collecting samples. Calculating species richness, species evenness and Simpson's Index comes later; those calculations depend on the sampling being sound in the first place.
Random Quadrat Sampling
Random sampling means selecting sampling positions by chance. In fieldwork, this is often done by laying a grid over the survey area and using a random number generator or random number table to choose coordinates. The key idea is that the student does not choose positions by eye.
Quadrats are square frames used to sample organisms in a known area. They are most suitable for plants, lichens, algae on a surface, and slow-moving or sessile organisms. A quadrat can be used to record the number of individuals, the presence or absence of a species, frequency across quadrats, or percentage cover when individual organisms are hard to separate.
[DIAGRAM: sampling_strategy_equipment_map: Lesson 080: Sampling biodiversity in habitats - diagram 01; asset_slug: 080_m04_2_1_sampling_biodiversity_in_habitats__diagram_01; recommended_method: drawn_biology; description: A clean line diagram showing a habitat survey area with random quadrat coordinates, a systematic belt transect through an environmental gradient, stratified regions, and simple line icons for a quadrat, sweep net, pitfall trap and pooter.]
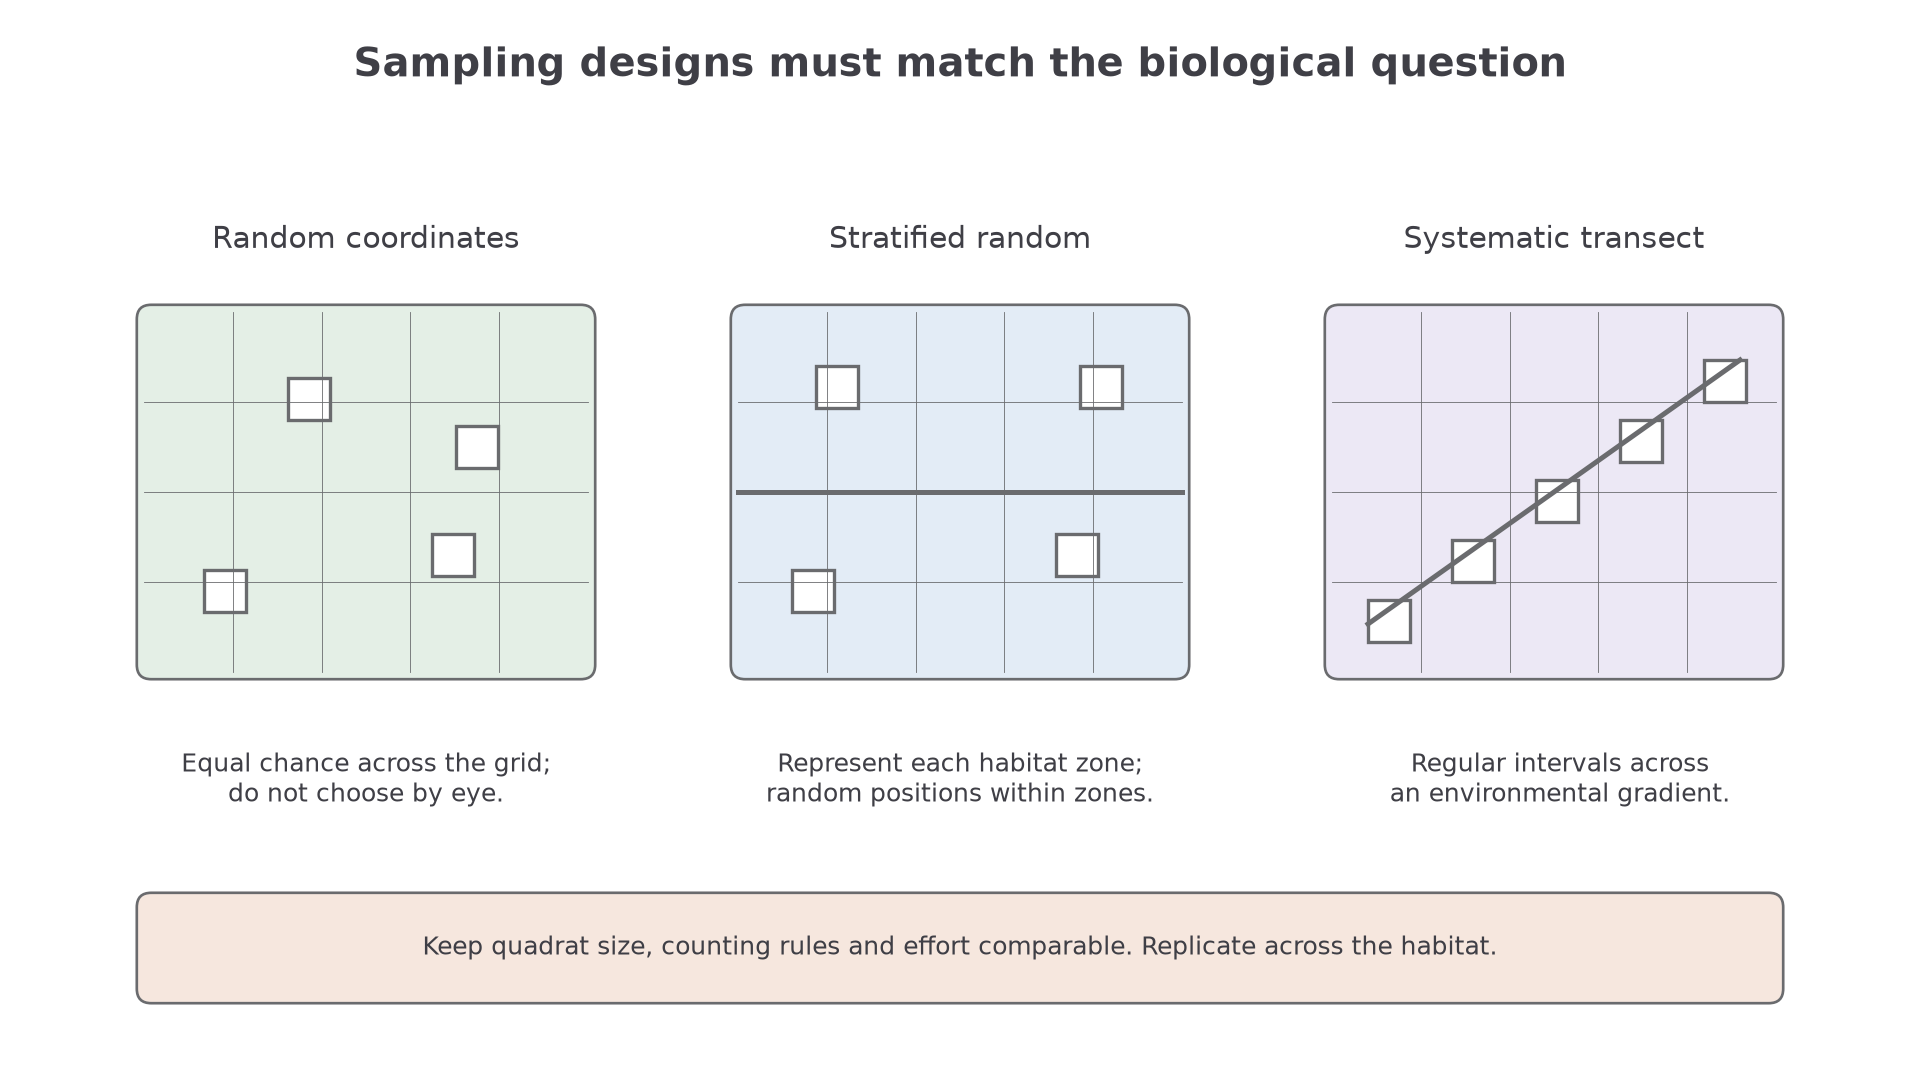
A clear random quadrat method has a sequence:
- Mark out the habitat area with measuring tapes or a grid.
- Generate random coordinates.
- Place the same size quadrat at each coordinate using a consistent rule, such as placing the lower left corner on the coordinate.
- Identify and record all target organisms in each quadrat.
- Repeat with enough quadrats to make the sample more representative.
- Calculate a summary such as mean number per quadrat or mean density.
Estimating density from quadrat data
A student uses ten 0.25 m² quadrats in a meadow. The total number of daisy plants counted is 38.
Total area sampled = 10 × 0.25 = 2.50 m²
Mean density = total number counted / total area sampled
Mean density = 38 / 2.50 = 15.2 plants m⁻²
The value is an estimate for the habitat. It is stronger if the quadrats were placed randomly and enough quadrats were used.
Random does not mean careless. The quadrat size should suit the organism, the same counting rule should be used each time, and uncertain identifications should be handled consistently, for example by using an identification key.
For plants crossing a frame edge, use a pre-agreed rule, such as count individuals rooted inside and include only two designated boundary edges. For overlapping grasses, percentage cover may be more repeatable than pretending each shoot is a separate plant. Frequency is ; it measures occurrence, not how many individuals occupy each quadrat. If a species occurs in 6 of 20 quadrats, frequency is 30%.
A mean density of across a representative habitat gives an estimated total of plants. This extrapolation assumes the sample density represents the unsampled area.
If a grid contains 100 equally eligible quadrat positions, a single random draw gives each position probability 1/100. Random selection reduces deliberate choice bias; it does not guarantee that a small sample will contain every rare species.
Non-random Sampling Designs
Non-random sampling means the positions are not chosen entirely by chance. That sounds less fair, but it can be useful when the habitat itself has a pattern that random sampling might miss.
| Design | How it is carried out | When it is useful | Main caution |
|---|---|---|---|
| opportunistic | sample organisms or places that are easiest to access | quick survey or pilot work | strongly biased because the sampler chooses what is convenient |
| stratified | divide the habitat into sub-areas, then sample within each sub-area | habitat has clear zones, such as dry grass, damp hollow and shrub edge | the strata must be chosen sensibly and sampled fairly |
| systematic | sample at regular intervals, often along a transect | there is an environmental gradient, such as distance from a path or shore | may miss patchy organisms between intervals |
Stratified sampling is often strongest when each stratum is sampled randomly. For example, if 40% of the habitat is short grass and 60% is shrub edge, a student could take 40% of their samples randomly from short grass and 60% randomly from shrub edge. This helps avoid missing organisms that occur only in one part of the habitat.
Systematic sampling is different. A line transect is placed across the habitat and samples are taken at fixed distances. If quadrats are placed along the transect, this becomes a belt transect. This is useful when the question is about change across space, such as how plant abundance changes from open grassland into woodland.
Random sampling is best for avoiding human choice bias in a fairly uniform area. Stratified sampling is best for a habitat with clear sub-areas. Systematic sampling is best for investigating change along a gradient.
Continue this lesson.
You’re previewing NovaLearn without an account. Create a free account to read the rest.
Create free account