1.1.2(a)-(c) - Practical techniques, units and recording data
Good biology practical work is not just "doing the experiment". It means using apparatus correctly, recording each measurement with a suitable unit, and presenting observations so another scientist can understand what happened. In this lesson, you will learn the implementation habits OCR can test in written questions: correct technique, appropriate units, and clear formats for observations and data.
Using Apparatus And Techniques Correctly
To implement a practical well, you must connect the apparatus to the measurement you need. A balance measures mass, a stopwatch measures time, a thermometer or temperature probe measures temperature, a ruler or microscope graticule measures length, pH paper or a pH meter estimates or measures pH, and instruments such as a colorimeter or potometer are used in particular biological investigations.
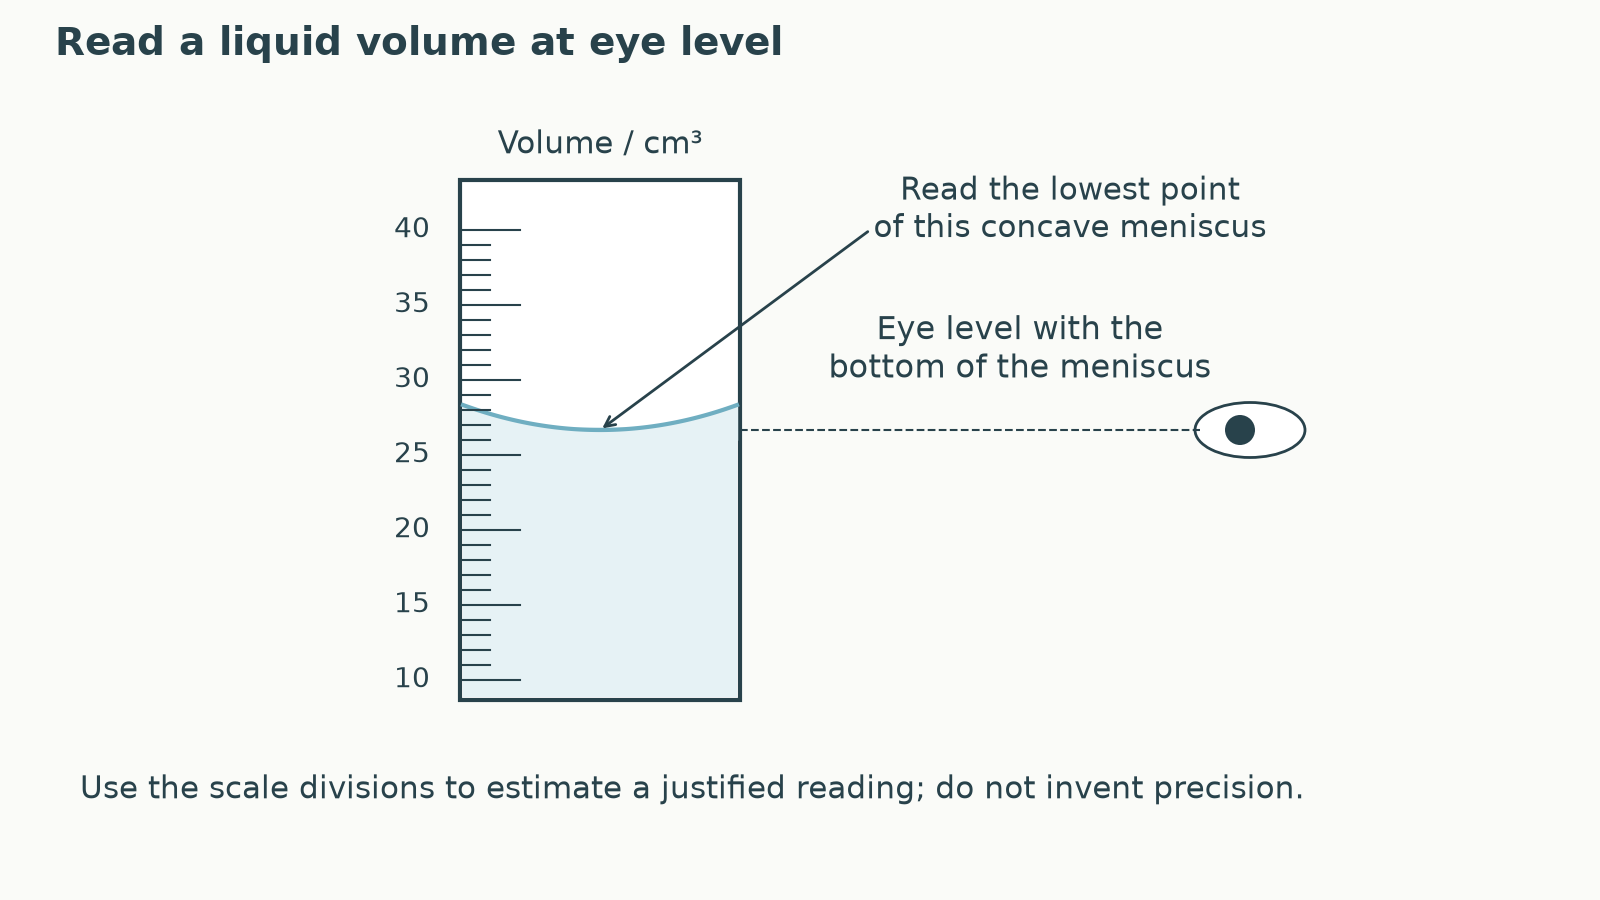
"Correctly" has three parts. The apparatus must be suitable for the quantity being measured, it must be used in a way that gives a valid reading, and the technique must be carried out safely and methodically. For example, reading a meniscus at eye level reduces parallax error when measuring volume. Zeroing a balance before adding a sample stops the container mass being included. Keeping a colorimeter cuvette clean and using a suitable blank helps the reading represent absorbance of the sample, not dirt or solvent.
This lesson does not require you to memorise every later PAG method in detail. The skill is transferable: when a practical context is described, ask, "What am I trying to measure, and which apparatus measures that quantity accurately enough?"
Choosing apparatus for a measurement
A student wants to compare the pH of two soil samples after mixing each with distilled water.
A suitable choice is a pH meter or pH probe because the measured quantity is pH and the comparison needs a numerical value. Universal indicator would give only an approximate colour-based estimate, so it may be less suitable if small differences in pH matter.
The same reasoning works across biology. A potometer is for water uptake by a shoot, not for observing where dye appears inside a stem. A microscope is useful for viewing stained tissue sections, not for measuring total water uptake. A measuring cylinder may be adequate for rough volumes, but a pipette or burette is better where a more precise volume is needed.
[DIAGRAM: 002_meniscus: Concave liquid meniscus viewed horizontally at its bottom with a graduated measuring scale; parallax avoided.; asset_slug: 002_meniscus; recommended_method: drawn_biology; description: Concave liquid meniscus viewed horizontally at its bottom with a graduated measuring scale; parallax avoided.]
Choosing Units And Recording Precision
A unit tells the reader what scale a measurement uses. OCR's mathematical skill M0.1 includes recognising and using appropriate units, converting between units where needed, and working out units for rates.
Common biology measurements include:
| Quantity | Common unit examples |
|---|---|
| mass | g |
| time | s, min or h |
| volume | cm³ or dm³ |
| small volume | microlitre or mm³ where appropriate |
| length | m, cm, mm or µm |
| temperature | °C |
| concentration | mol dm⁻³ or g dm⁻³ |
| light intensity | lux |
| heart rate | bpm |
| pH | no unit |
Unit conversions must change the value as well as the symbol: 1 cm³ = 1 mL = 1000 µL, 1 dm³ = 1000 cm³, and 1 mm = 1000 µm. For example, 250 µL = 0.250 cm³.
The unit should match the apparatus and the biology. If a pipette is labelled in cm³, record volume in cm³. Use the stated concentration unit consistently; mol dm⁻³ describes amount concentration, whereas g dm⁻³ describes mass concentration, so these cannot be interchanged without the molar mass. pH is a number on a pH scale, so do not add a unit after a pH value.
Resolution is the smallest change a measuring instrument can distinguish. Precision describes the closeness of repeated readings, not simply the number of displayed digits. With a digital device, record the digits shown, unless the method gives a special instruction. With an analogue scale, read between divisions only where the scale and method justify that estimate; do not invent decimal places. Use a supplied recording instruction when one is given. Raw readings of the same quantity should use the same number of decimal places because they were taken with the same apparatus.
Deriving a rate unit
A shoot takes up 0.42 cm³ of water in 14 min.
Rate of water uptake = volume taken up / time
Rate = 0.42 cm³ / 14 min = 0.030 cm³ min⁻¹
The unit is cm³ min⁻¹ because a volume in cm³ has been divided by a time in minutes.
A common error is giving the value but not the unit. Another is mixing units inside one calculation, such as using cm³ for one volume and dm³ for another without converting. The unit is part of the biological meaning of the result.
Recording Raw Observations During The Practical
Raw data are the measurements or observations recorded before processing. They should be written down as the practical is carried out, not reconstructed later from memory. This reduces transcription errors and makes the results easier to check.
Quantitative data are numerical measurements, such as mass, time, length, temperature or absorbance. They need a quantity, a unit and a consistent precision. If all repeat mass readings were taken on the same balance, they should all be recorded to the same number of decimal places.
Qualitative observations are descriptive rather than numerical. In biology, these might include colour changes, visible precipitates, the position of dye in tissue, cloudiness in a suspension, or whether colonies are present on an agar plate. Good qualitative records still need a clear format. "Tube B turned blue-black after iodine was added" is more useful than "changed".
Here is a compact example of raw data being recorded methodically:
| Sucrose concentration / mol dm⁻³ | Initial mass / g | Final mass / g | Observation |
|---|---|---|---|
| 0.0 | 2.31 | 2.64 | cylinder firmer |
| 0.2 | 2.28 | 2.36 | slight increase in firmness |
| 0.4 | 2.33 | 2.20 | cylinder softer |
Notice that the mass readings use the same decimal places, the units are in the headings, and the qualitative observation is in words. The table does not show calculation steps inside the cells.
For a results table, put units in the column headings, not after every value in the body of the table.
That rule makes each column easier to scan and prevents the data cells from becoming cluttered.
Presenting Data In An Appropriate Format
Presentation is part of scientific communication. The format should help the reader see what was changed, what was measured, and what the results show.
For most practical work, a table is the safest first format. The independent variable goes in the first column. Dependent-variable readings go to the right. Repeats should be shown separately. Processed values, such as means or rates, belong on the far right after the raw values.
Repairing a results table
Weak format:
| concentration | 1 | 2 | mean |
|---|---|---|---|
| 0.1 mol dm⁻³ | 11 mm | 13 mm | 12 mm |
Better format:
| Sucrose concentration / mol dm⁻³ | Length change repeat 1 / mm | Length change repeat 2 / mm | Mean length change / mm |
|---|---|---|---|
| 0.1 | 11 | 13 | 12 |
The better table puts the unit in each quantitative heading, keeps units out of the body, names the measured quantity, and separates raw repeats from the processed mean.
Graphs can also be an appropriate presentation format, but this lesson only needs the choice of format, not detailed plotting or gradient work. A bar chart suits discontinuous categories, such as different species or treatment groups. A line graph can suit a continuous independent variable, such as temperature or concentration. A scatter plot can show a relationship between two quantitative variables, including experimental data; with a suitable trend line it can also show activity against temperature. A scattergram is particularly useful for associations such as body mass and metabolic rate. A histogram is for grouped continuous frequency data.
Quick Recap
Choose apparatus for the quantity measured, use it correctly, record raw readings immediately with appropriate units and precision, and present the results so the measurements can be checked.