3.1.2(j) - Oxygen dissociation curves and the Bohr effect
Haemoglobin is useful because it does not hold oxygen with the same strength in every situation. This lesson teaches how to read oxygen dissociation curves for adult and fetal human haemoglobin, and how carbon dioxide changes the curve in the Bohr effect. The goal is to turn a curve into a biological explanation: where oxygen is loaded, where it is released, and why fetal haemoglobin can take oxygen from maternal blood in the placenta.
The language of dissociation curves
An oxygen dissociation curve is a graph of how saturated haemoglobin is with oxygen at different partial pressures of oxygen. The x-axis is partial pressure of oxygen, often written as pO₂. This is a measure of oxygen availability: oxygen moves from a region with a higher pO₂ to a region with a lower pO₂.
The y-axis is the percentage saturation of haemoglobin with oxygen. If haemoglobin is 80% saturated, then 80% of its oxygen-binding sites are occupied by oxygen. Oxygen can associate with haemoglobin, meaning bind to it, or dissociate from haemoglobin, meaning leave it.
Affinity for oxygen
The affinity of haemoglobin for oxygen is how readily haemoglobin binds to oxygen at a given pO₂.
Adult human haemoglobin has a sigmoid, or S-shaped, oxygen dissociation curve. At very low pO₂, little oxygen is bound. Binding of the first oxygen changes haemoglobin’s shape, increasing the affinity of its remaining binding sites. This positive cooperativity produces the steep middle region. In the middle part of the curve, a small change in pO₂ causes a large change in saturation, so oxygen can be unloaded effectively in tissues. At high pO₂, the curve levels off because most binding sites are already occupied.
The most important graph-reading rule is this: compare curves at the same pO₂. The curve with the higher percentage saturation at that pO₂ has the higher oxygen affinity.
Adult and fetal haemoglobin
Fetal haemoglobin has a higher affinity for oxygen than adult haemoglobin. On an oxygen dissociation graph, this means the fetal curve is shifted to the left of the adult curve.
[DIAGRAM: adult_fetal_oxygen_dissociation_curves: Lesson 065: Oxygen dissociation curves and the Bohr effect - diagram 01; asset_slug: 065_m03_1_2_oxygen_dissociation_curves_and_the_bohr_effect__diagram_01; recommended_method: matplotlib; description: 16:9 graph of adult and fetal human haemoglobin saturation against pO₂, with the fetal sigmoid curve to the left of the adult curve and a same-pO₂ comparison showing higher fetal saturation.]
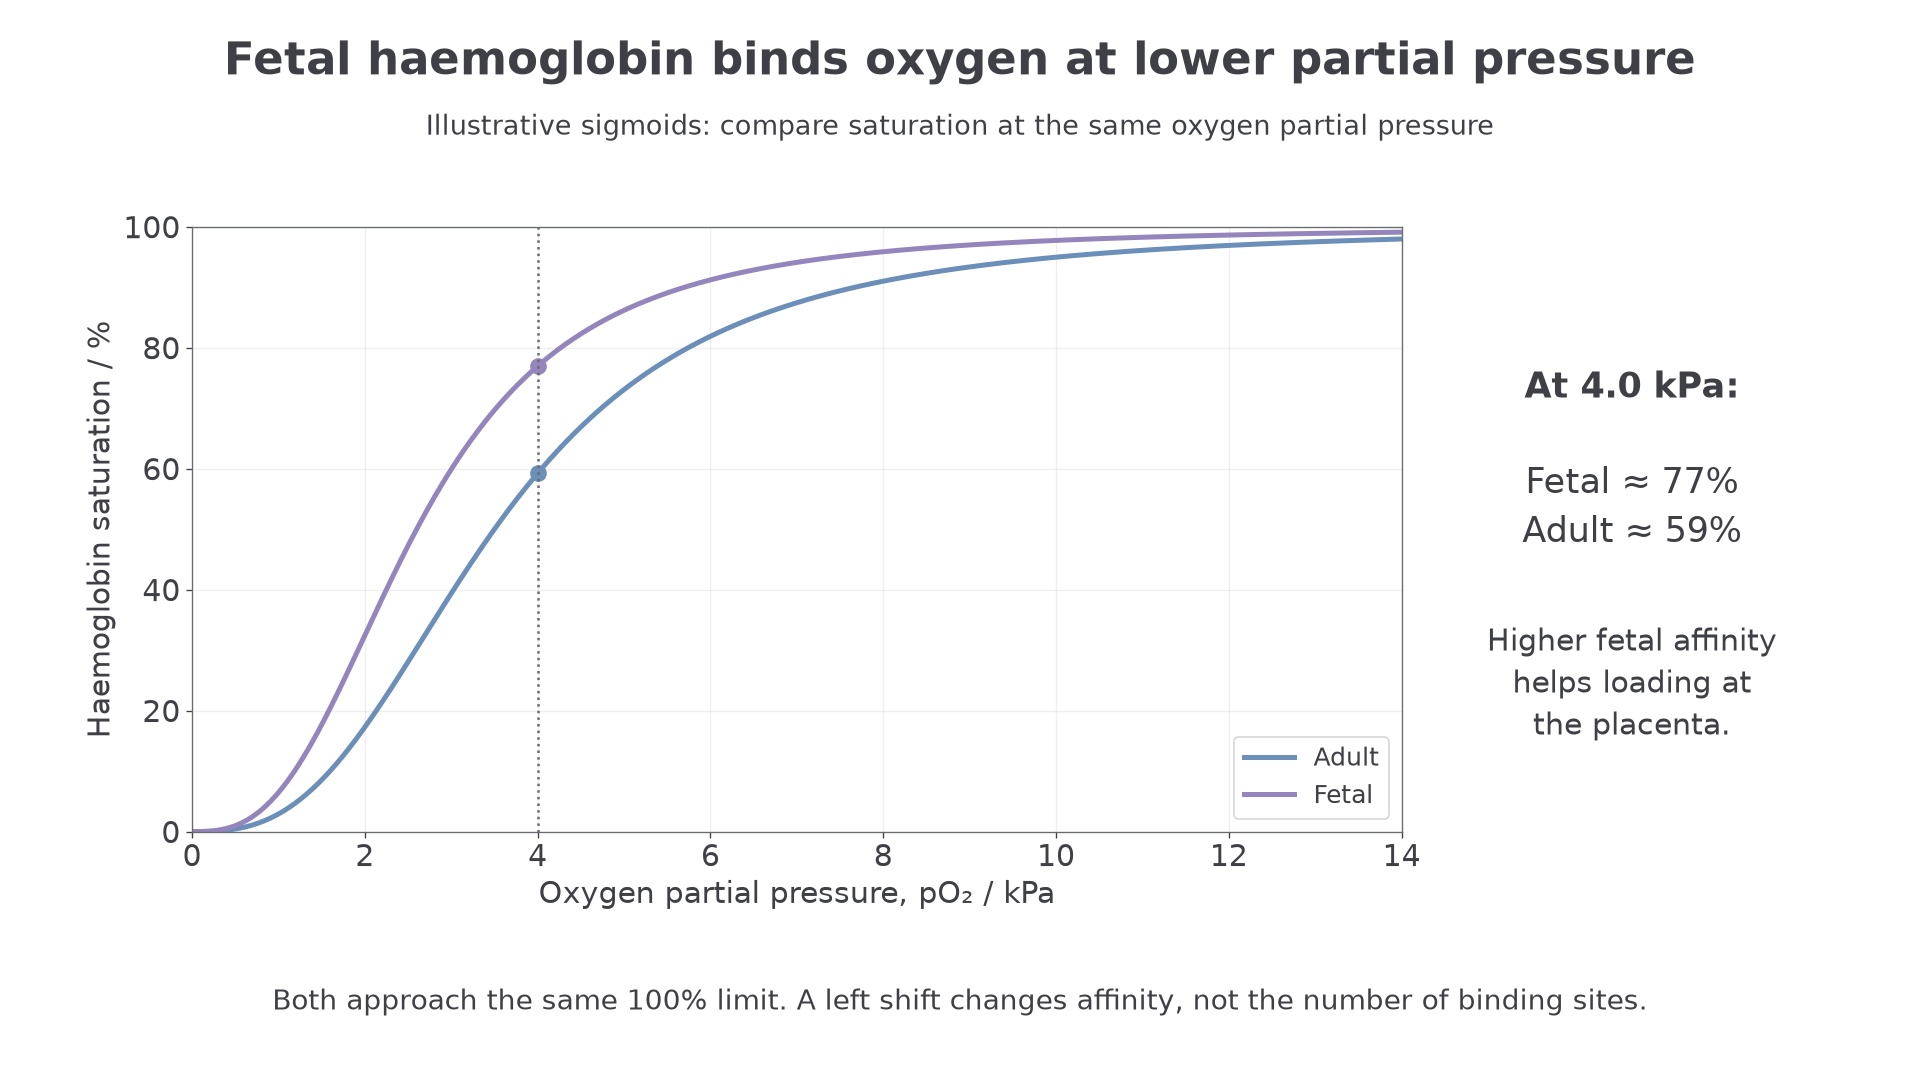
The fetal curve should not be thought of as "taller". Both adult and fetal haemoglobin can become highly saturated at high pO₂. The difference is that fetal haemoglobin becomes highly saturated at a lower pO₂.
This matters in the placenta. The pO₂ in the placenta is relatively low compared with the lungs. At this low pO₂, oxygen dissociates from maternal adult haemoglobin. Because fetal haemoglobin has a higher affinity for oxygen, fetal haemoglobin can associate with that oxygen at the same low pO₂. Maternal and fetal blood remain separate. Dissolved oxygen diffuses across the placental barrier down a partial-pressure gradient; binding to fetal haemoglobin removes dissolved oxygen and helps maintain that gradient. Oxygen does not pass directly from one haemoglobin molecule to another across the placenta.
A left-shifted fetal haemoglobin curve means higher oxygen affinity at the same pO₂, allowing fetal haemoglobin to bind oxygen where maternal adult haemoglobin is releasing it.
The precise molecular reason for fetal haemoglobin's higher affinity is not the key assessment point here. The important skill is to read the curve position and explain the significance of the different affinities.
Continue this lesson.
You’re previewing NovaLearn without an account. Create a free account to read the rest.
Create free account