6.2.1(h)(i)-(ii) - Microbial growth curves and growth practicals
Microorganisms reproduce fast enough that their population can change by several orders of magnitude in a few hours. In this lesson, you will learn the standard growth curve for a closed culture, how exponential growth is calculated, and how broth cultures, serial dilution and viable counts are used to investigate factors that affect microbial growth.
Closed Culture Curve
A closed culture is a culture in which no fresh nutrients are added and waste products are not removed during the investigation. This is also called a batch culture. The important consequence is that conditions inside the culture change as microorganisms use nutrients, respire, divide and release waste products.
Closed Culture
A closed culture is a microbial culture where nutrients are not replaced and waste products are not removed while the population grows.
When the number of viable microorganisms is plotted against time, a standard closed-culture growth curve has four main phases.
In the lag phase, the microorganisms are alive and metabolically active, but there is little increase in population size. Cells may be adapting to the medium, synthesising enzymes, repairing damage after transfer, and preparing for division.
In the exponential phase, also called the log phase, cells divide by binary fission at a roughly constant division frequency per cell. If conditions remain suitable, each generation doubles the population. On a graph with a logarithmic y-axis, this phase appears as a steep straight section.
In the stationary phase, the total number of viable cells is roughly constant because the rate of cell division is about equal to the rate of cell death. This does not mean nothing is happening. Nutrients and oxygen may be becoming limiting, waste products may accumulate, and competition within the culture increases.
In the death phase, the number of viable cells decreases because the death rate is greater than the division rate. The usual closed-culture reasons are nutrient exhaustion and toxic waste accumulation. Do not explain the ordinary death phase by saying bacterial enzymes have denatured unless the question specifically involves harmful high temperature.
Use the phase names precisely. OCR-style answers often reward "lag", "exponential/log", "stationary" and "death/decline" when you link them to what is happening in the population.
The curve is a population pattern, not a rule for every cell. Some cells may die while others divide, especially in the stationary phase. The graph shows the net effect on viable cell number.
[DIAGRAM: closed_culture_growth: Closed culture growth curve; asset_slug: 161_m06_2_1_microbial_growth_curves_and_growth_practicals__diagram_01; description: Logarithmic viable-count axis with power-of-ten ticks and four labelled phases.]
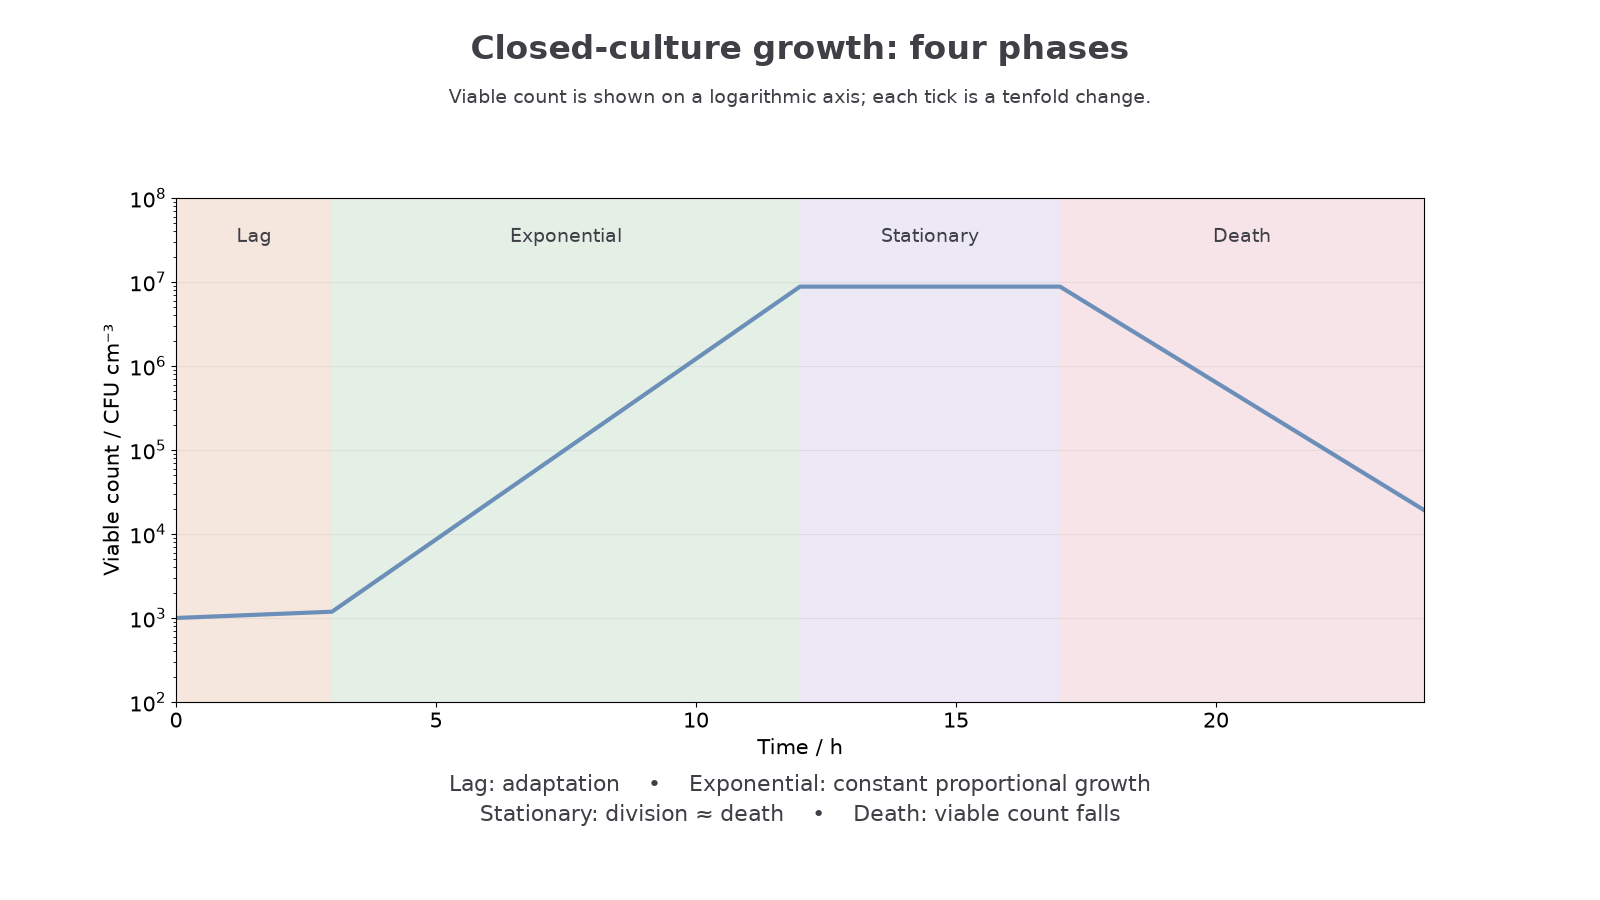
A linear count axis shows exponential growth as an increasingly steep curve, because more cells divide each generation. A logarithmic count axis shows the same constant proportional increase as a straight line. Do not infer a constant absolute addition of cells from a straight line on a log plot.
Exponential Growth Calculations
During the exponential phase, the population can double once per generation. OCR requires the formula for the number of individual organisms after a number of generations:
Microbial Doubling Formula
is the final number of organisms, is the initial number of organisms, and is the number of generations. A generation is one round of division that doubles the population.
If a question gives time and generation time, first calculate the number of generations:
Number Of Generations
Then substitute into .
Using the doubling formula
A broth culture contains bacterial cells. During exponential growth, the generation time is 30 minutes. Estimate the number of cells after 3 hours.
Convert 3 hours to minutes:
Find the number of generations:
Substitute into the formula:
The estimated final population is cells.
The formula assumes that every generation doubles the population and that conditions remain suitable. It is most appropriate for the exponential phase, not the lag, stationary or death phases.
Logarithms can be used when you know and and need to find :
Finding Generations With Logarithms
For example, if a population increases from to , then , so generations. If this took 4 hours, the generation time was hours, or 30 minutes.
Measuring Viable Cells
A growth curve needs repeated estimates of microbial population size. In a broth culture, the culture can be mixed and small samples can be removed at set times. Mixing matters because microorganisms may not be evenly distributed through the liquid.
One common method is a viable plate count. A viable cell is one that can divide under the incubation conditions used. The result is usually reported as colony-forming units, or CFU, because one visible colony may have grown from one cell or from a small clump of cells.
Colony-Forming Unit
A colony-forming unit, or CFU, is a viable cell or group of cells that can grow into one visible colony under the culture conditions used.
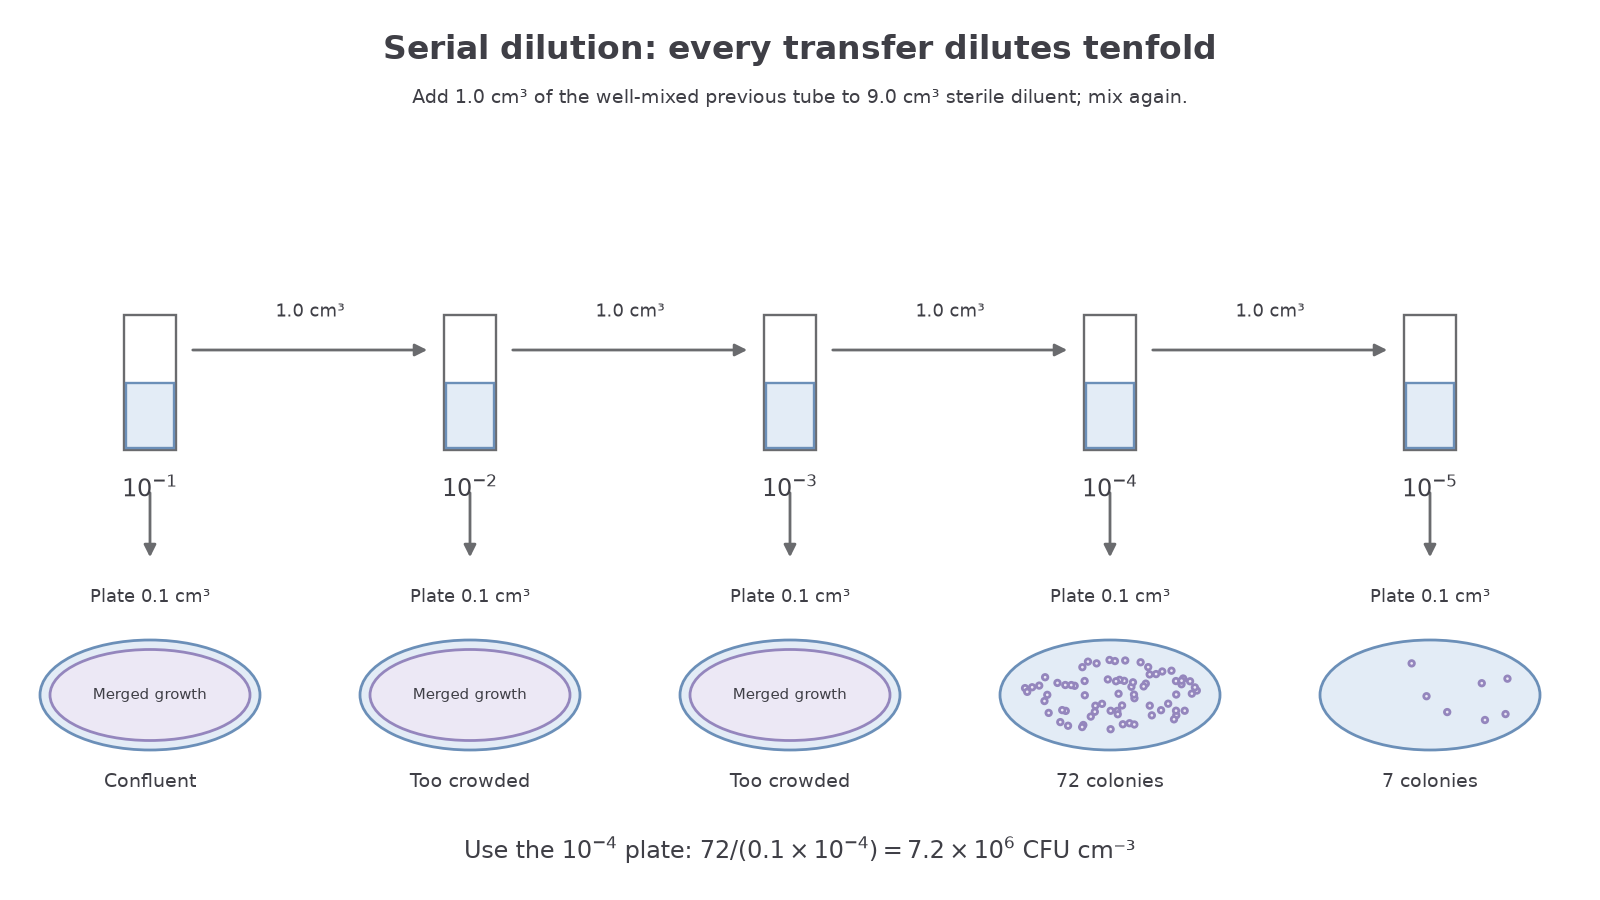
A dense broth culture cannot usually be counted directly on agar because colonies would merge. A serial dilution reduces the concentration step by step. In a tenfold dilution, 1.0 cm³ of culture is mixed with 9.0 cm³ of sterile diluent, giving a dilution of . Repeating this step gives , , and so on.
The aim is to choose a plate with separate, countable colonies and enough colonies to give a representative estimate. Too many colonies merge and become unreliable. Too few colonies make the estimate strongly affected by chance.
The calculation uses the colony count, the dilution plated, and the volume plated:
Viable Count
If 0.1 cm³ of a dilution produces 64 colonies:
This estimates the concentration of viable microorganisms in the original broth culture.
[DIAGRAM: serial_dilution: Serial dilution and viable count; asset_slug: 161_m06_2_1_microbial_growth_curves_and_growth_practicals__diagram_02; description: Five tenfold transfers, 0.1 cm³ plated, countable 72-colony 10^-4 plate and 7-colony 10^-5 plate.]
A colorimeter provides a faster indirect estimate: increased cell density scatters more light, increasing absorbance or turbidity. Blank it with the same uninoculated medium and use a calibration curve over its reliable range. It counts the effect of dead cells as well as live cells and other particles, so turbidity may remain high after the viable count falls. A viable plate count takes longer but measures colony-forming capacity under the chosen conditions.
Continue this lesson.
You’re previewing NovaLearn without an account. Create a free account to read the rest.
Create free account