3.1.1(e) - Spirometry, vital capacity and oxygen uptake data
Spirometry turns breathing into a trace that can be measured. In this lesson you will learn how tidal volume, vital capacity, breathing rate and oxygen uptake are connected, and how to interpret primary or secondary data from a spirometer or data logger. The important skill is not just naming the volumes: it is using the graph carefully enough to make a justified biological conclusion.
Reading the trace
A spirometer records changes in the volume of air moved during breathing. A normal breath makes a small up-and-down wave on the trace. A forced maximum breath makes a much larger movement.
Tidal Volume
The volume of air breathed in or out during one normal breath.
Vital Capacity
The maximum volume of air that can be moved in or out of the lungs in one forced breath.
Vital capacity is not the same as tidal volume. Tidal volume is the ordinary breath-by-breath movement. Vital capacity is measured only when the person breathes in as far as possible and then breathes out as far as possible, or the reverse. On a trace, it is the vertical difference between the forced maximum and forced minimum volumes.
[DIAGRAM: spirometer_trace_relationships: Lesson 055: Spirometry, vital capacity and oxygen uptake data - diagram 01; asset_slug: 055_m03_1_1_spirometry_vital_capacity_and_oxygen_uptake_data__diagram_01; recommended_method: drawn_biology; description: A 16:9 pale-colour spirometer trace showing tidal-volume oscillations, a forced vital-capacity manoeuvre, breathing-rate counting over a known time, oxygen uptake as a fall in the baseline when carbon dioxide is absorbed, and deeper or more frequent breaths at higher oxygen demand.]
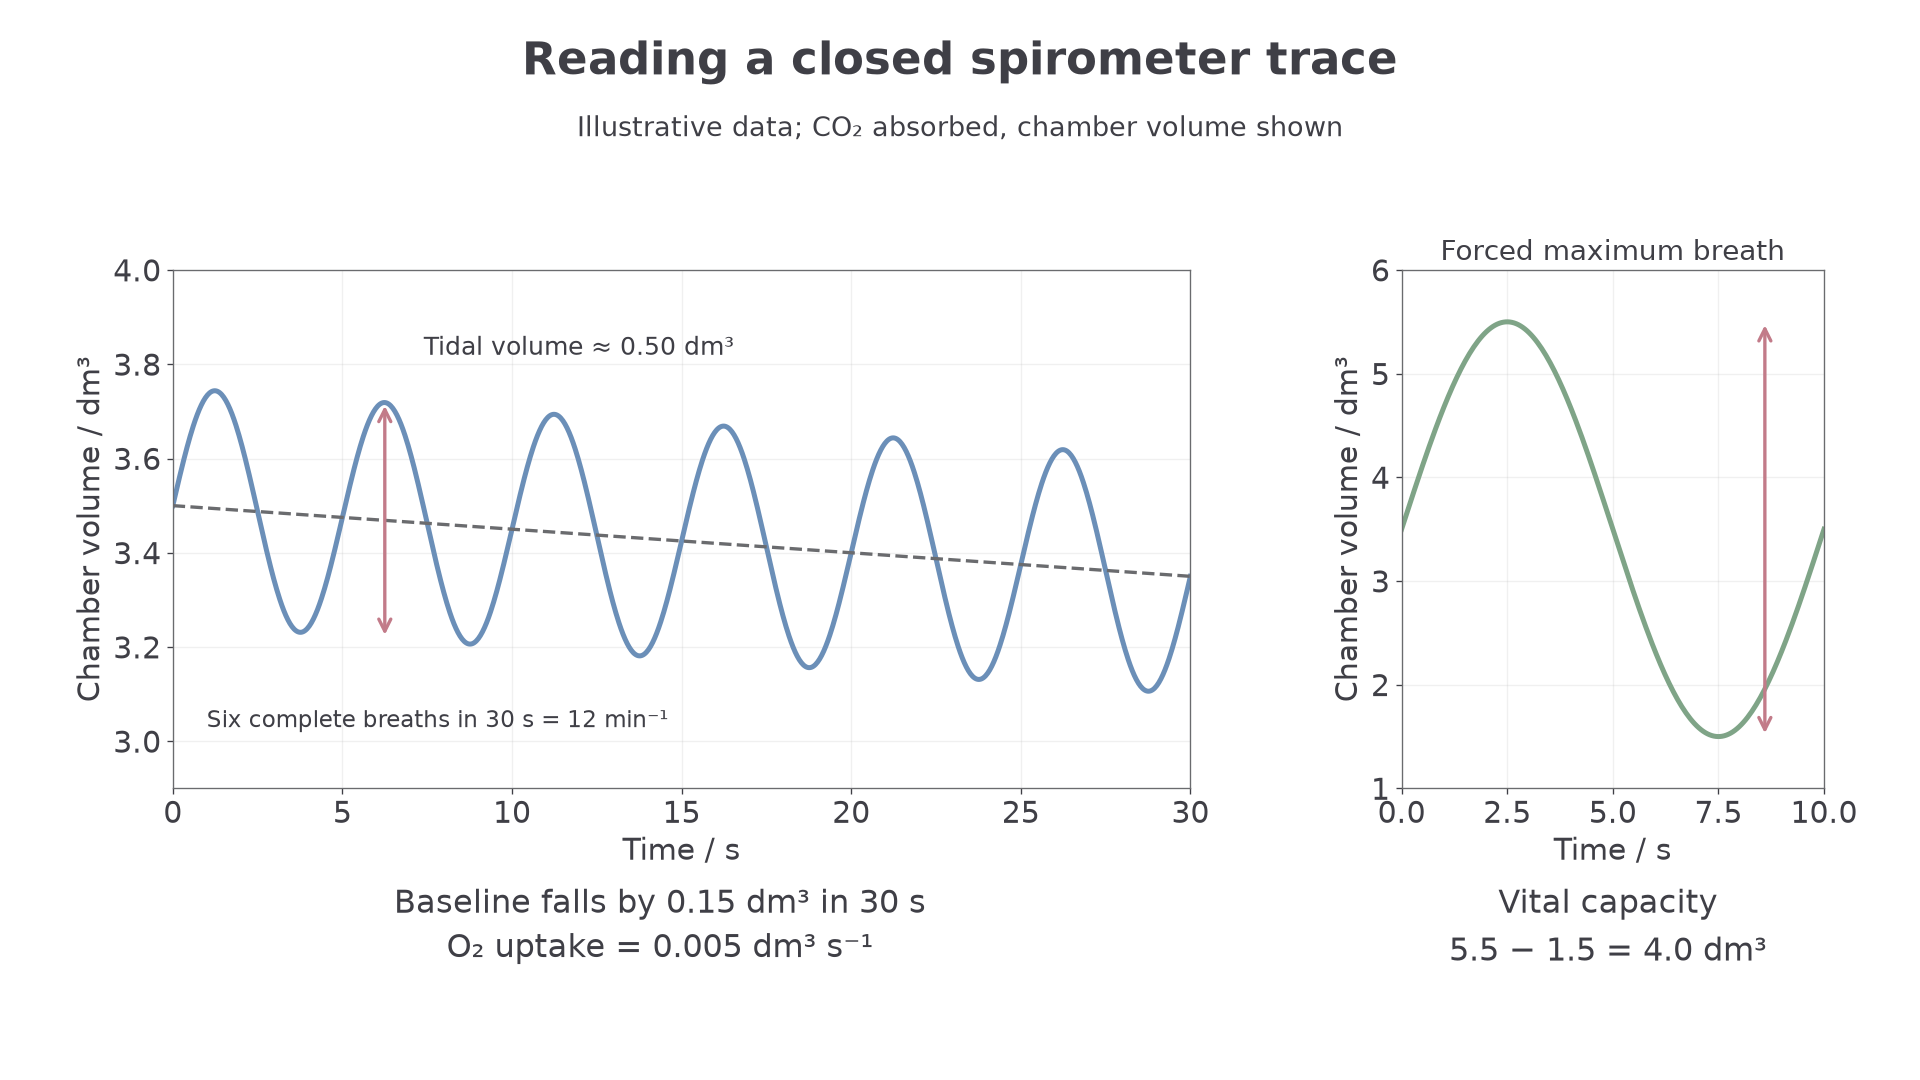
In a closed spirometer setup, the person may breathe from a chamber containing air. This is a supervised, monitored demonstration, not a home experiment. If carbon dioxide is absorbed by soda lime, the total gas volume in the chamber gradually falls because oxygen is being removed from the chamber and taken up by the body. That fall in the baseline is the part of the trace used to estimate oxygen uptake.
Tidal volume is the height of a normal breath, vital capacity is the full forced range, breathing rate is how often breaths occur, and oxygen uptake is inferred from oxygen removed over time.
Breathing rate and ventilation
Breathing rate is the number of breaths per minute. On a trace, count complete breaths over a known time interval, then convert to a one-minute rate.
Breathing Rate
Tidal volume and breathing rate together tell you how much air is moved per minute. This is often called ventilation per minute. It is not automatically the same as oxygen uptake, because exhaled air still contains oxygen and gas exchange depends on what is removed from the air and taken into the blood.
Ventilation Per Minute
Counting Breaths And Calculating Ventilation
A spirometer trace shows 6 complete breaths in 30 s. The tidal volume is 0.50 dm³.
Breathing rate:
Ventilation per minute:
So this person is moving 6.0 dm³ of air in and out each minute during this interval. This describes ventilation, not yet oxygen uptake.
Oxygen uptake from a spirometer
Oxygen uptake is the volume of oxygen taken up by the body in a stated time. A closed spirometer can estimate this if carbon dioxide is absorbed. The subject inhales oxygen from the chamber, uses some of it in aerobic respiration, and exhales carbon dioxide. Soda lime removes the carbon dioxide, so the falling baseline mainly represents oxygen removed from the chamber.
Oxygen Uptake Rate
Measure the decline between corresponding points in the breathing cycle, such as two troughs, or use the trend through several breaths. Comparing a peak with a trough would mix tidal movement with oxygen removal. A flat trace can indicate no net chamber-volume change; it does not by itself prove that cells have stopped respiring.
Use the units in the question. If the trace is in dm³ and the answer is requested in cm³, convert using:
Oxygen Consumption Per Kilogram
During the first 120 s of a spirometer experiment, the baseline falls by 0.84 dm³. The subject has a mass of 70 kg.
Convert the volume:
Oxygen consumption per kg during this period:
Oxygen uptake rate:
This means the subject removed 12 cm³ of oxygen per kg body mass during the 120 s interval, or 0.0070 dm³ of oxygen per second overall.
When a question gives a trace, read the graph scale first. OCR can credit correct method even if the final number is slightly different because of graph-reading tolerance, but the units and conversion still matter.
Continue this lesson.
You’re previewing NovaLearn without an account. Create a free account to read the rest.
Create free account