4.2.1(c)-(d) - Species richness, evenness and Simpson's Index
Biodiversity can be measured more carefully than by saying that a habitat "has lots of organisms". In this lesson you will learn how species richness and species evenness are measured from habitat data, how Simpson's Index of Diversity is calculated from a provided formula, and how to interpret high and low values without overclaiming from the sample.
Richness And Evenness
Species biodiversity depends on two linked ideas: how many different species are present and how evenly the individuals are shared between those species. These are called species richness and species evenness.
Species richness
The number of different species present in a habitat or sample.
Richness gives one part of species biodiversity: the species list. The second part asks whether the individuals are spread evenly across that list.
Species evenness
How similar the abundances of the different species are in a habitat or sample.
To measure species richness, collect a representative sample and count how many different species are recorded. If a quadrat survey records daisy, clover, buttercup, plantain and ryegrass, the species richness for that sample is 5.
To measure species evenness, do not just count species names. Count the number of individuals of each species, or another valid abundance measure if individuals cannot be separated easily, then compare the relative abundances. A habitat with 10 individuals of each of five species has high evenness. A habitat with 46 individuals of one species and only one or two individuals of the other species has low evenness, even if the richness is still 5.
[DIAGRAM: richness_evenness_simpson_comparison: Lesson 081: Species richness, evenness and Simpson's Index - diagram 01; asset_slug: 081_m04_2_1_species_richness_evenness_and_simpsons_index__diagram_01; recommended_method: drawn_biology; description: 16:9 NovaLearn-style deterministic comparison of two habitat samples with the same five-species richness but different abundance evenness, showing simple bar patterns and Simpson's Index values high versus low.]
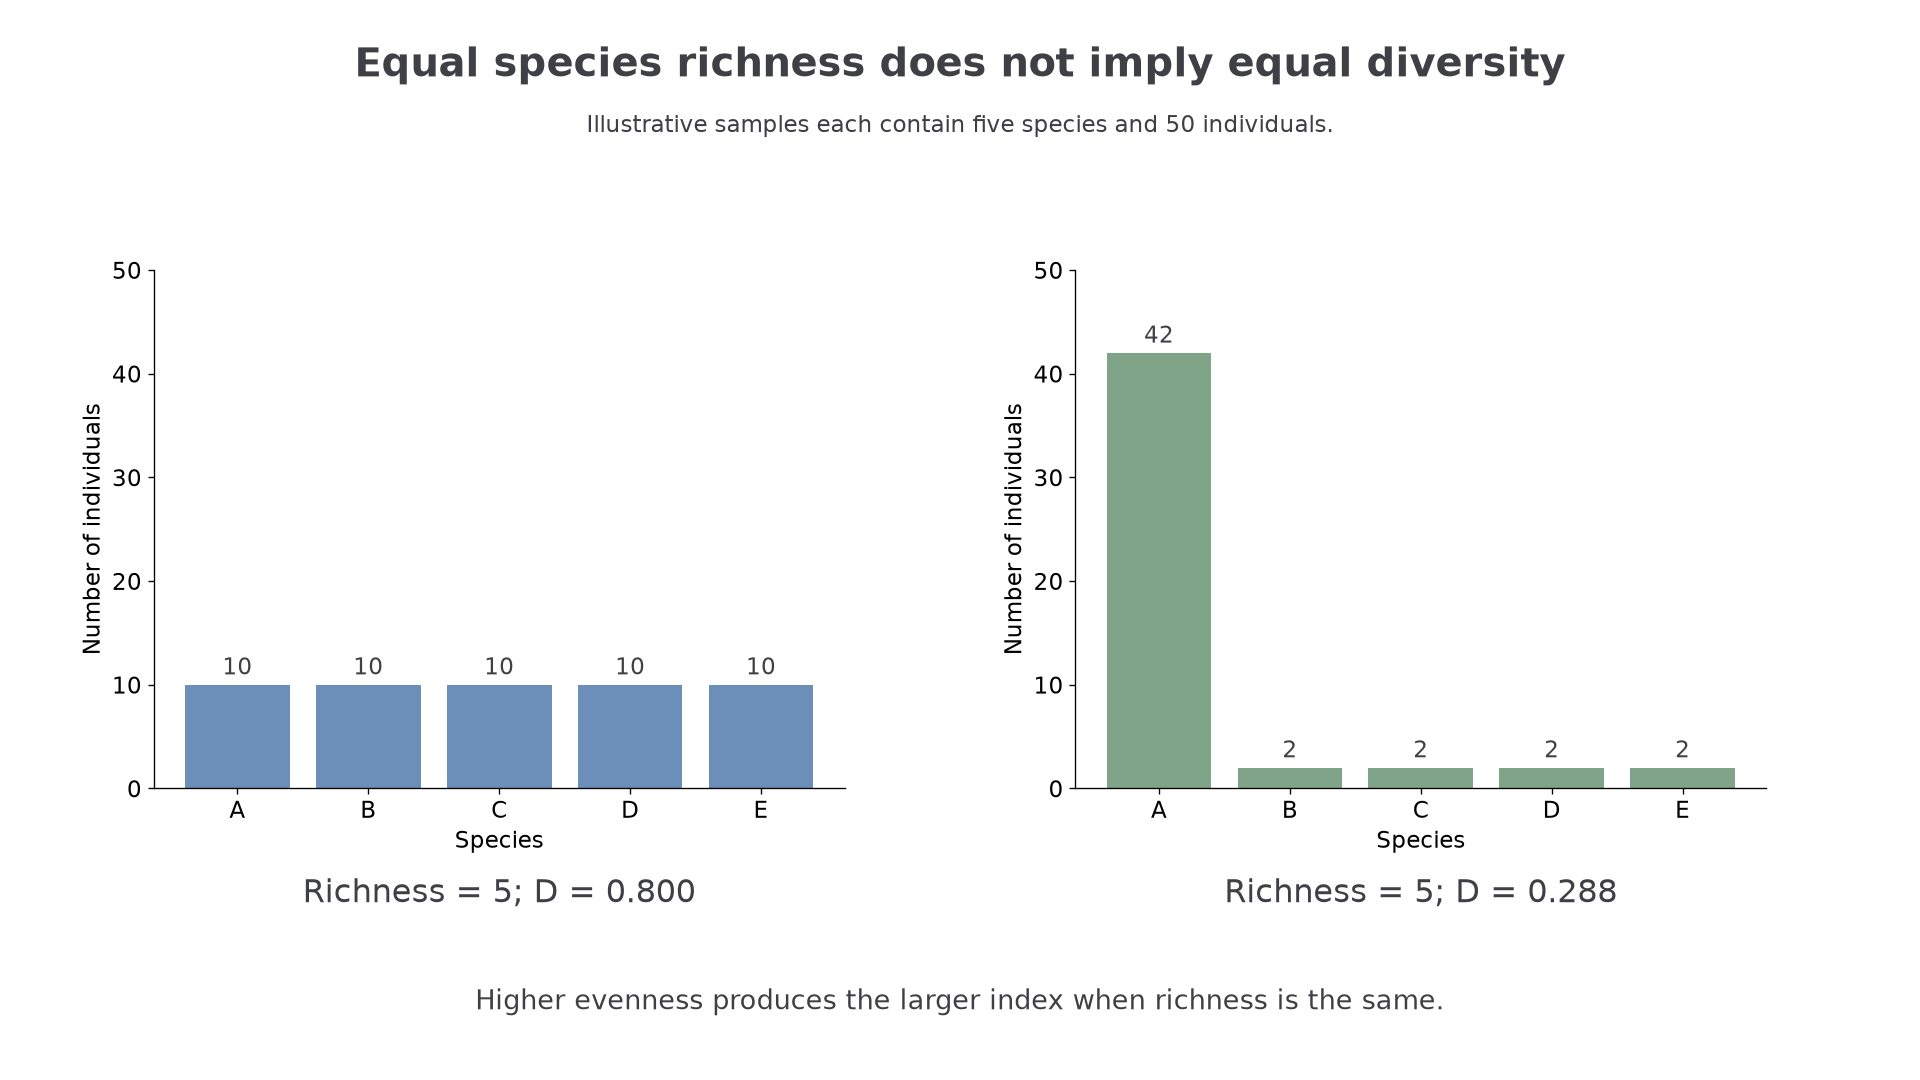
The diagram shows the trap: the two habitats have the same richness, but they do not have the same species biodiversity. The more even habitat is more diverse because a randomly encountered individual is less likely to belong to one dominant species.
Species richness is not the total number of organisms. A sample with 100 grass plants and no other species has richness 1.
Richness and evenness describe different features of the same sample.
Preparing Count Data
Simpson's Index uses the abundance of each species compared with the total abundance of all species in the sample. The two key symbols are:
| Symbol | Meaning |
|---|---|
| number of individuals of one species | |
| total number of individuals of all species in the sample |
The fraction is the relative abundance of one species. It tells you what proportion of the sample belongs to that species. If one species has and the total sample has , then that species makes up of the sample.
Good Simpson's Index work begins with a tidy table:
| Species | Number of individuals, n | n / N |
|---|---|---|
| species A | 18 | 18 / 30 = 0.600 |
| species B | 6 | 6 / 30 = 0.200 |
| species C | 6 | 6 / 30 = 0.200 |
| total | N = 30 | 1.000 |
The values should add to 1, allowing for rounding. This is a useful check because it means all the species counts have been included.
The sampling behind the table matters. Two habitats should be compared only if the sampling effort is comparable, for example the same number and size of quadrats, the same trap duration, or the same sweep-net effort. If one area is sampled more thoroughly, its richness and evenness may look different because of the method rather than the habitat.
Before calculating Simpson's Index, identify for each species, calculate , and convert each count into a relative abundance .
This short check keeps the focus on the data preparation step before the full index is calculated.
Calculating Simpson's Index
Simpson's Index of Diversity, , uses the relative abundance of each species to give one value for species biodiversity in a habitat.
Simpson's Index of Diversity
The formula will be provided where needed in assessments, so the skill is using and interpreting it. The symbol means "add all the values". For each species, calculate , square it, add the squared values, then subtract the total from 1.
Calculating D from a sample
A sample contains three plant species.
| Species | n | n / N | (n / N)^2 |
|---|---|---|---|
| species A | 18 | 18 / 30 = 0.600 | 0.360 |
| species B | 6 | 6 / 30 = 0.200 | 0.040 |
| species C | 6 | 6 / 30 = 0.200 | 0.040 |
Sum of squared relative abundances:
Substitute into the formula:
So the Simpson's Index of Diversity for this sample is 0.560, or 0.56 to two significant figures.
Continue this lesson.
You’re previewing NovaLearn without an account. Create a free account to read the rest.
Create free account