6.1.2(c) - Chi-squared test for genetic crosses
Genetic crosses often predict a neat phenotypic ratio, but real offspring counts rarely land exactly on that ratio. This lesson teaches how to use the chi-squared test to decide whether the difference between observed and expected results is small enough to be explained by chance. The formula and critical value table are normally provided, but you still need to know where the expected numbers come from and how to write a careful conclusion.
Why Test Genetic Ratios
A genetic diagram can predict an expected phenotypic ratio, such as 3:1 in a simple monohybrid cross or 9:3:3:1 in an unlinked dihybrid cross. The actual offspring counted from a cross are the observed results. Observed results are usually close to, but not exactly the same as, the expected ratio because fertilisation and the inheritance of alleles involve chance.
The chi-squared test is used here as a goodness-of-fit test. It asks whether the observed counts fit the expected counts closely enough, or whether the difference is statistically significant.
Observed And Expected Results
Observed results are the actual numbers counted in each phenotype class. Expected results are the numbers predicted from the genetic ratio and the total number of offspring counted.
The null hypothesis is the starting idea being tested. For this lesson, it is usually: there is no significant difference between the observed and expected results, and any difference is due to chance.
[DIAGRAM: chi_squared_workflow: Lesson 143: Chi-squared test for genetic crosses - diagram 01; asset_slug: 143_m06_1_2_chi_squared_test_for_genetic_crosses__diagram_01; recommended_method: drawn_biology; description: A grey-on-white workflow showing how a genetic model leads to expected numbers, chi-squared terms, degrees of freedom, a critical-value comparison and a conclusion.]
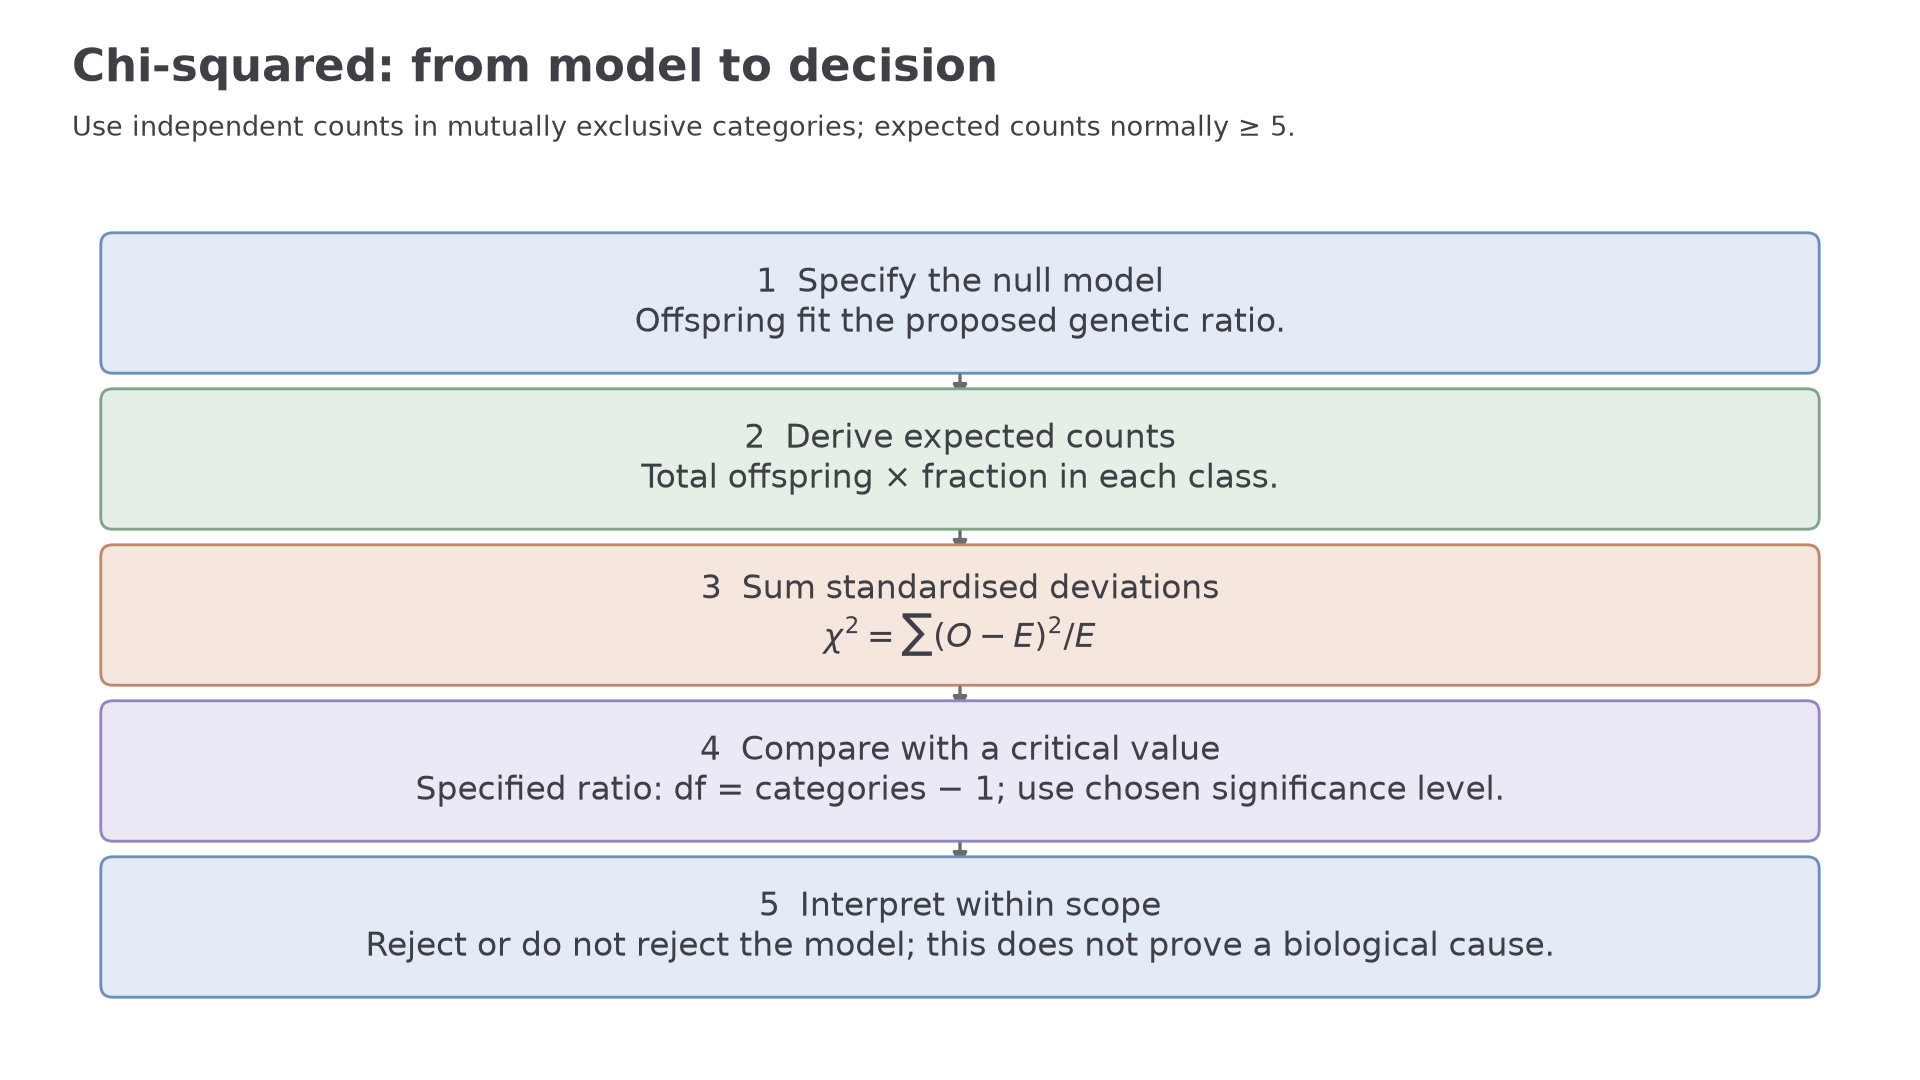
The important point is that chi-squared does not test whether your diagram was drawn neatly. It tests the size of the difference between counts. That is why the expected values must come from the predicted ratio, not from a guess based on the observed data.
Expected Numbers From Ratios
Expected numbers are calculated from the total observed offspring and the predicted ratio. Do not compare a ratio directly with raw counts. Convert the ratio into expected counts first.
For a 3:1 ratio, there are 4 ratio parts in total. If 100 offspring are counted, the expected numbers are:
- dominant phenotype:
- recessive phenotype:
Expected numbers can be decimals. That is acceptable because they are model predictions, not actual individuals. What matters is that the expected numbers add up to the same total as the observed numbers.
Converting A Dihybrid Ratio
A cross is expected to produce four phenotypes in a 9:3:3:1 ratio. There are 160 offspring in total.
Total ratio parts =
Expected numbers:
- phenotype 1:
- phenotype 2:
- phenotype 3:
- phenotype 4:
The expected numbers add to 160, matching the total observed offspring.
This step is a common source of errors. A student who uses 9, 3, 3 and 1 as the expected numbers for a sample of 160 is comparing the observed data with the ratio labels, not with expected counts.
If a question gives a predicted ratio and observed offspring counts, first find the total number of observed offspring. Then multiply that total by each fraction of the ratio.
In genetic crosses, each offspring should be counted in one phenotype class only. Chi-squared is applied to category counts, so classes must be mutually exclusive and observations independent. Expected counts should be large enough for the approximation, normally at least 5 in each category in these school examples.
Calculate Chi-squared
The chi-squared formula is provided; the task is to select a suitable test, derive expected counts and interpret the result.
Chi-squared Test
In this formula, is the observed frequency, or observed count, for one phenotype class. is the expected frequency for that same phenotype class. The sigma symbol means "sum": calculate for every phenotype class, then add the terms.
Squaring the difference makes negative and positive deviations contribute positively and gives disproportionately greater weight to larger deviations. Dividing by the expected number standardises the deviation, so a difference of 5 in a small expected class matters more than a difference of 5 in a very large expected class.
Continue this lesson.
You’re previewing NovaLearn without an account. Create a free account to read the rest.
Create free account