5.2.1(g)(i)-(ii) - Photosynthesis limiting factors and practicals
Photosynthesis does not run at one fixed speed. Its rate depends on the environmental factor that is currently holding the process back, and that same factor can change the amounts of GP, TP and RuBP inside chloroplasts. In this lesson you will connect limiting factors to the Calvin cycle, water stress, and practical investigations that estimate photosynthesis rate from oxygen production or carbon dioxide uptake.
The Limiting Factor Idea
A limiting factor is the factor in shortest supply relative to the plant's need. If that factor is increased, the rate of photosynthesis increases. If the rate no longer increases when that factor is increased, another factor has become limiting.
Limiting Factor
A limiting factor is a variable that restricts the rate of a process because it is in shortest supply or furthest from its optimum.
The main limiting factors for photosynthesis are light intensity, carbon dioxide concentration and temperature. These are not just labels for graphs; each one links to a different part of photosynthesis.
[DIAGRAM: limiting_factor_response_curves: Lesson 127: Factors affecting photosynthesis and rate practicals - diagram 01; asset_slug: 127_m05_2_1_factors_affecting_photosynthesis_and_rate_practicals__diagram_01; recommended_method: drawn_biology; description: A clean 16:9 set of three line graphs for photosynthesis rate against light intensity, carbon dioxide concentration and temperature, showing initial limiting regions, plateaux where another factor limits, and an optimum temperature curve.]
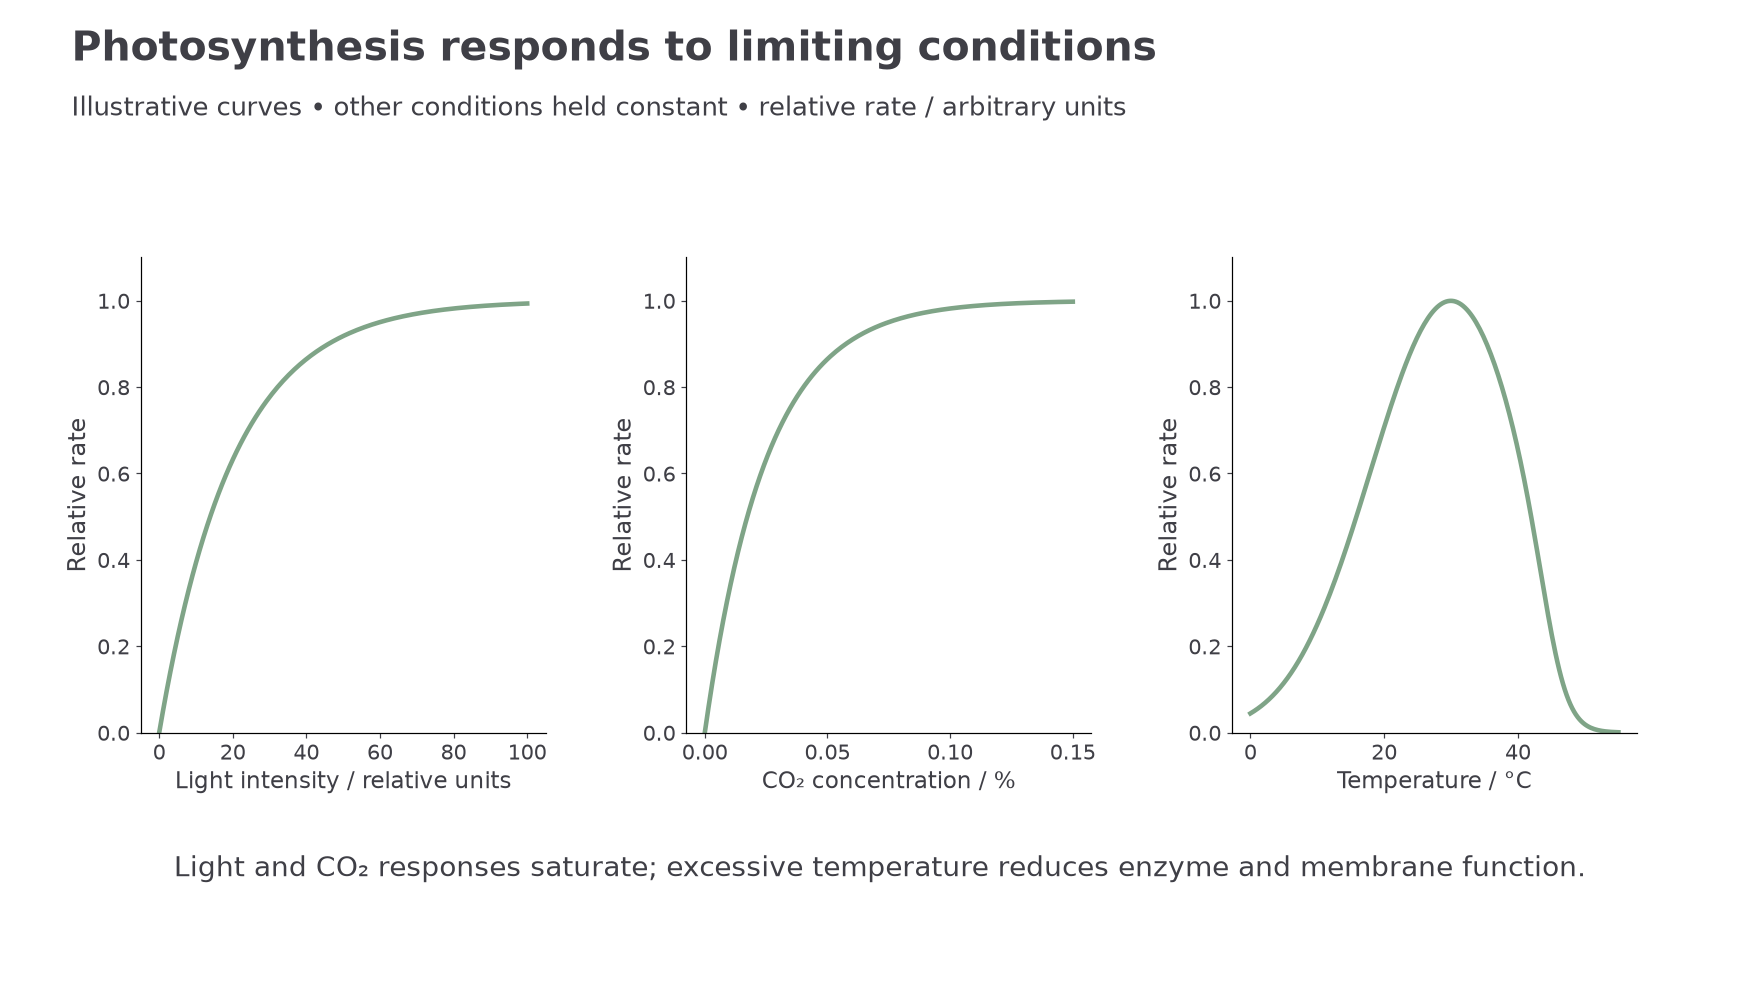
When light intensity is low, increasing light intensity increases rate because the light-dependent stage can produce more ATP and reduced NADP. At higher light intensity, the graph plateaus because something else, such as carbon dioxide concentration or temperature, is now limiting.
When carbon dioxide concentration is low, increasing carbon dioxide concentration increases rate because more CO₂ can combine with RuBP in the Calvin cycle. At higher carbon dioxide concentration, the graph plateaus if light intensity, temperature or another condition becomes limiting.
Temperature behaves slightly differently because photosynthesis is enzyme controlled. As temperature rises from a low value, particles have more kinetic energy and enzyme-controlled reactions usually occur faster. Above an optimum, enzymes and membranes are affected, so the rate falls rather than simply plateauing.
Water is a special case in this specification point. Water is a raw material for photosynthesis, but water is not usually treated as the direct limiting factor in ordinary rate graphs. The specification asks you to understand water stress: if a plant loses more water than it can replace, stomata close. Closing stomata reduces water loss, but it also reduces CO₂ diffusion into the leaf, so photosynthesis rate can fall because carbon dioxide supply falls.
Why Each Factor Changes Rate
To explain limiting factors well, connect the external condition to the photosynthetic reaction it affects.
| Factor changed | Main link to photosynthesis | Expected rate effect |
|---|---|---|
| light intensity | Light provides energy for the light-dependent stage, producing ATP and reduced NADP. | Rate increases with light intensity until another factor limits. |
| carbon dioxide concentration | CO₂ combines with RuBP in the Calvin cycle to form GP. | Rate increases with CO₂ concentration until another factor limits. |
| temperature | Enzymes control many steps of photosynthesis, including Calvin cycle reactions. | Rate rises to an optimum, then falls if enzymes or membranes are disrupted. |
| water stress | Stomatal closure reduces CO₂ entry into the leaf. | Rate may fall because the carbon dioxide supply falls. |
The strongest explanations use cause and effect. "Light makes photosynthesis happen" is too vague. A better explanation is: increasing light intensity can increase ATP and reduced NADP production in the light-dependent stage, which supports the conversion of GP to TP and regeneration of RuBP in the Calvin cycle.
Use the phrase light intensity, not just "light", when the variable is the amount of light reaching the plant.
Carbon dioxide concentration affects the Calvin cycle more directly. CO₂ is fixed when it combines with RuBP. If CO₂ concentration is low, fewer RuBP molecules combine with CO₂ per unit time, so less GP is produced.
Temperature affects enzyme-controlled reactions. A low temperature slows reactions because particles have less kinetic energy and there are fewer successful enzyme-substrate collisions. A high temperature can reduce rate because enzyme active sites and membranes are disrupted. Do not write a single "higher temperature always increases photosynthesis" rule; it only applies below the optimum.
Water stress is a trade-off. Closing stomata helps reduce water loss by transpiration, but it also restricts diffusion of CO₂ into the leaf air spaces. That means the Calvin cycle receives less CO₂, even if light intensity is high.
GP TP And RuBP Patterns
The intermediate molecules in the Calvin cycle help you explain what is happening inside the chloroplast when a factor changes.
The simplified sequence is:
- CO₂ combines with RuBP to form GP.
- GP is reduced to TP using ATP and reduced NADP from the light-dependent stage.
- Most TP is used to regenerate RuBP, using ATP.
[DIAGRAM: calvin_intermediate_patterns: Lesson 127: Factors affecting photosynthesis and rate practicals - diagram 02; asset_slug: 127_m05_2_1_factors_affecting_photosynthesis_and_rate_practicals__diagram_02; recommended_method: drawn_biology; description: A clean 16:9 Calvin-cycle logic diagram showing CO2 plus RuBP to GP, GP to TP using ATP and reduced NADP, TP to RuBP, with side panels for low light and low CO2 effects on GP, TP and RuBP levels.]
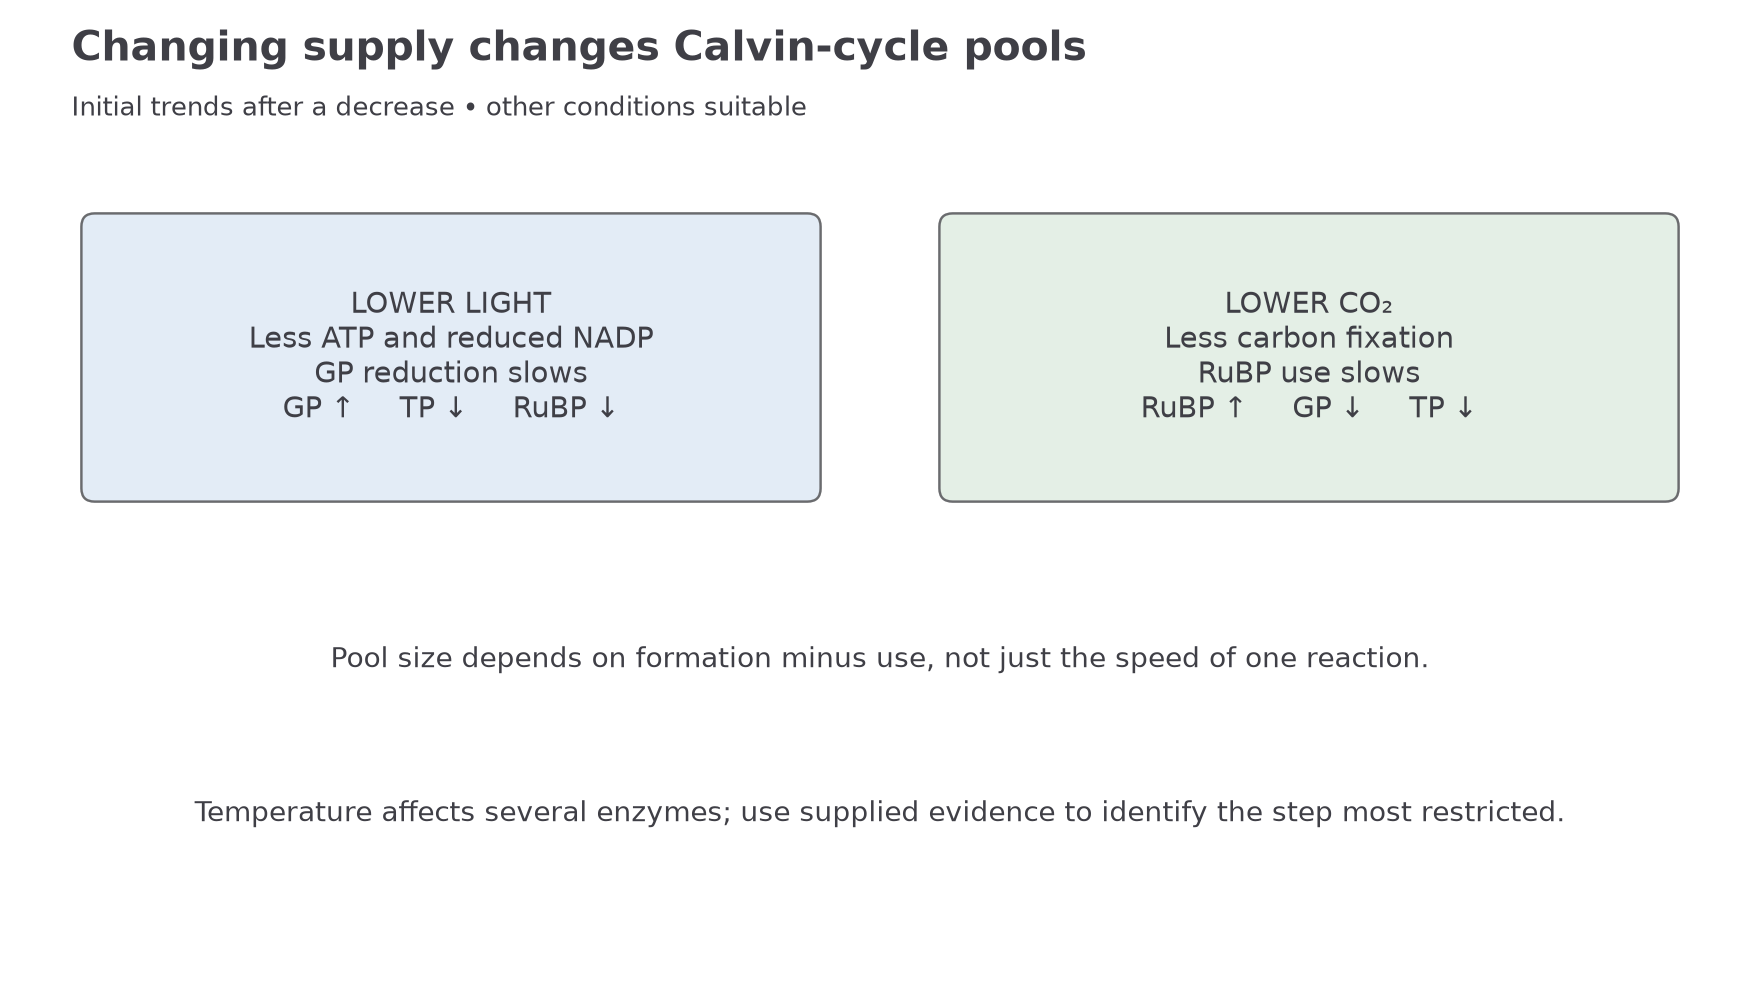
If light intensity falls, the light-dependent stage produces less ATP and reduced NADP. GP is then not reduced to TP as quickly. GP tends to build up, TP falls, and RuBP regeneration falls because less TP is available and ATP supply is lower.
If carbon dioxide concentration falls, less CO₂ combines with RuBP. RuBP tends to build up because it is not being used in carbon fixation as quickly. GP falls because less is being made, and TP also falls because less GP is available to be reduced.
| Change | Main process restricted | GP level | TP level | RuBP level |
|---|---|---|---|---|
| lower light intensity | ATP and reduced NADP supply from the light-dependent stage | increases | decreases | decreases |
| lower carbon dioxide concentration | carbon fixation of CO₂ with RuBP | decreases | decreases | increases |
Temperature patterns need more care. Changing temperature can affect several enzyme-controlled steps, not just one named molecule-to-molecule conversion. As temperature increases from a low value towards the optimum, Calvin cycle reactions usually turn over faster, so rate increases and GP, TP and RuBP are made and used more quickly. Above the optimum, enzymes and membranes are disrupted, so carbon fixation, reduction of GP and regeneration of RuBP can all be reduced. In a data question, the safest approach is to identify which step is being slowed, then predict that the intermediate before that step may accumulate while the product after that step may fall.
Predicting intermediate changes
A plant is moved from high light intensity to low light intensity while CO₂ concentration and temperature remain suitable.
Low light intensity reduces ATP and reduced NADP production in the light-dependent stage.
GP needs ATP and reduced NADP to be converted to TP, so GP accumulates.
Less TP is made, so TP decreases.
Less TP and less ATP are available for RuBP regeneration, so RuBP decreases.
Use the same step-before-and-after reasoning for a change in carbon dioxide concentration.
These predictions describe the initial response after a change while the other conditions remain suitable. A concentration is a pool size determined by both production and use; it is not itself a reaction rate. If cooling slows GP reduction more than fixation, GP initially rises and TP falls. If cooling mainly slows fixation while reduction continues, GP falls instead. Without information about the relative enzyme effects, temperature alone does not justify a universal up/down prediction for every intermediate.
Rate Practical Design
A practical investigation into photosynthesis rate needs a measurable dependent variable. Common school methods estimate rate by measuring oxygen production from pondweed or carbon dioxide uptake by algae or leaves.
Continue this lesson.
You’re previewing NovaLearn without an account. Create a free account to read the rest.
Create free account