6.1.2(b)(i) - Genetic diagrams for inheritance patterns
Genetic diagrams are a way of turning meiosis and fertilisation into a clear probability argument. In this lesson you will learn how to build diagrams for monogenic, dihybrid, multiple allele, codominant and sex-linked inheritance. The aim is not to memorise one square, but to use the same logic every time: parent genotypes give gametes, gametes combine at fertilisation, and the offspring genotypes are translated into phenotypes.
The language of a genetic diagram
A genetic diagram is only as good as its symbols. Before you draw a Punnett square or write a probability, set out what each allele means and what genotypes the parents have.
Allele
An allele is a version of a gene.
Genotype and phenotype
The genotype is the combination of alleles an organism has. The phenotype is the observable characteristic produced by the genotype and environment.
For a single autosomal gene with two alleles, a dominant allele is usually shown by a capital letter and a recessive allele by the same lower-case letter. For example, if B gives black fur and b gives white fur, then BB and Bb both produce black fur, while bb produces white fur.
Three notation points prevent most diagram errors:
| Term | Meaning in a diagram | Example |
|---|---|---|
| Homozygous | two identical alleles for a gene | BB or bb |
| Heterozygous | two different alleles for a gene | Bb |
| Gamete | one allele from each gene being considered | B or b, not Bb |
Gametes are haploid. That means a gamete carries one allele for each gene, not both alleles from the parent. If a parent is Bb, the possible gametes are B and b. If a parent is BB, the only possible gamete for that gene is B.
Monogenic inheritance diagrams
Monogenic inheritance means that the phenotype is controlled by one gene. A standard diagram has four steps: choose symbols, write parent genotypes, list gametes, then combine gametes to find offspring genotypes and phenotypes.
[DIAGRAM: genetic_diagram_workflow: Lesson 141: Genetic diagrams for inheritance patterns - diagram 01; asset_slug: 141_m06_1_2_genetic_diagrams_for_inheritance_patterns__diagram_01; recommended_method: drawn_biology; description: Four-step workflow for a monogenic genetic diagram, moving from allele symbols and parent genotypes to gametes, a Punnett square and phenotype probability.]
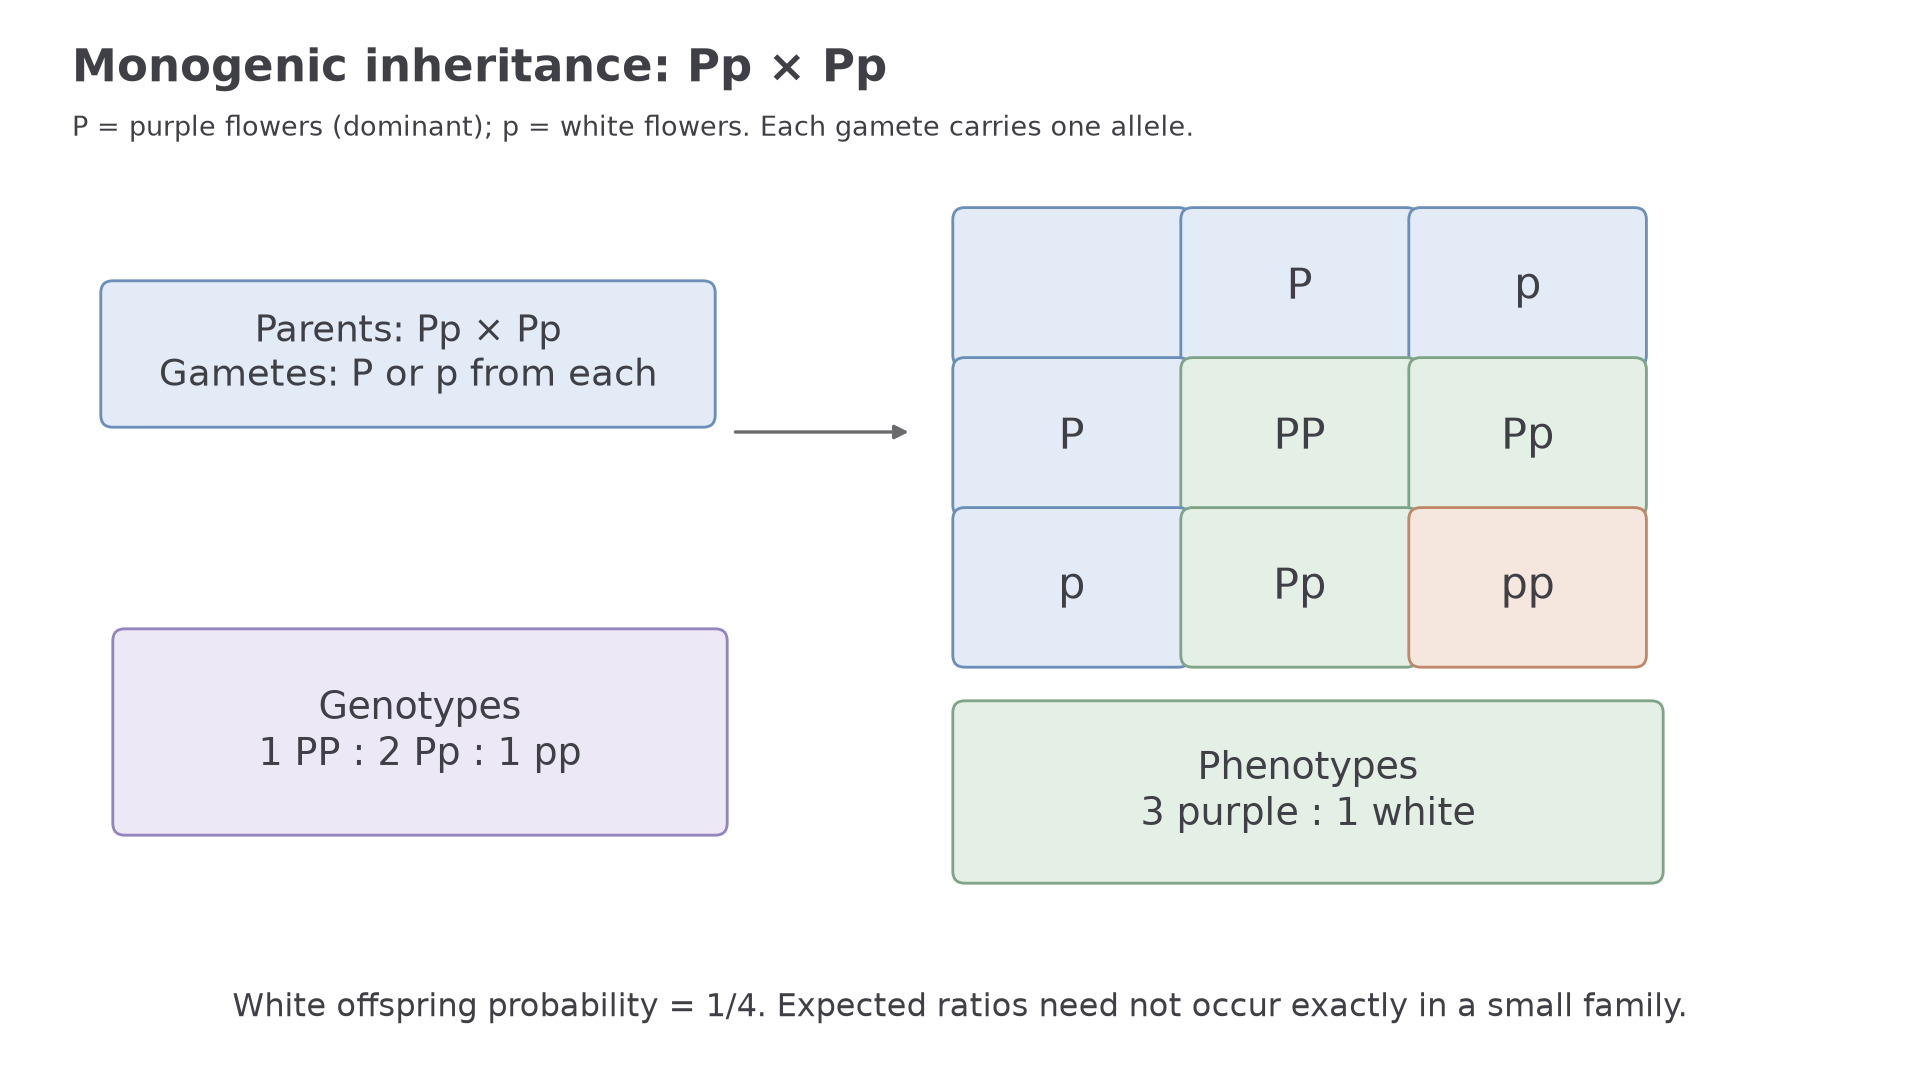
Suppose P gives purple flowers and is dominant to p, which gives white flowers. If two heterozygous purple plants are crossed:
| P gamete | p gamete | |
|---|---|---|
| P gamete | PP | Pp |
| p gamete | Pp | pp |
The genotypic ratio is 1 PP : 2 Pp : 1 pp. The phenotypic ratio is 3 purple : 1 white because PP and Pp both contain the dominant allele.
Monogenic probability
Question: In the cross Pp × pp, what is the probability of a white-flowered offspring?
- Parent genotypes: Pp and pp.
- Gametes: the Pp parent can produce P or p; the pp parent can produce only p.
- Offspring genotypes: Pp and pp.
- Phenotypes: Pp is purple; pp is white.
- Probability of white offspring = or 50%.
Ratios are expected probabilities. A small family or a small number of offspring may not show the exact ratio, because fertilisation is random.
Dihybrid inheritance diagrams
A dihybrid cross follows two genes at the same time. The key extra skill is making gametes with one allele from each gene. For AaBb, the possible gametes are AB, Ab, aB and ab.
The usual 9 : 3 : 3 : 1 dihybrid ratio only applies when both genes assort independently and each gene has a simple dominant-recessive relationship. Genes close together on the same chromosome are linked: parental combinations are more frequent than recombinant combinations because crossing over between them is relatively uncommon. All four gamete types can still occur, but they need not be equally frequent. Gene interaction (epistasis) can also change phenotype classes; both effects are developed in the next lesson.
[DIAGRAM: dihybrid_punnett_grid: Lesson 141: Genetic diagrams for inheritance patterns - diagram 02; asset_slug: 141_m06_1_2_genetic_diagrams_for_inheritance_patterns__diagram_02; recommended_method: drawn_biology; description: Dihybrid Punnett square for AaBb x AaBb, showing the four gamete types from each parent and the resulting 9:3:3:1 phenotype ratio under independent assortment.]
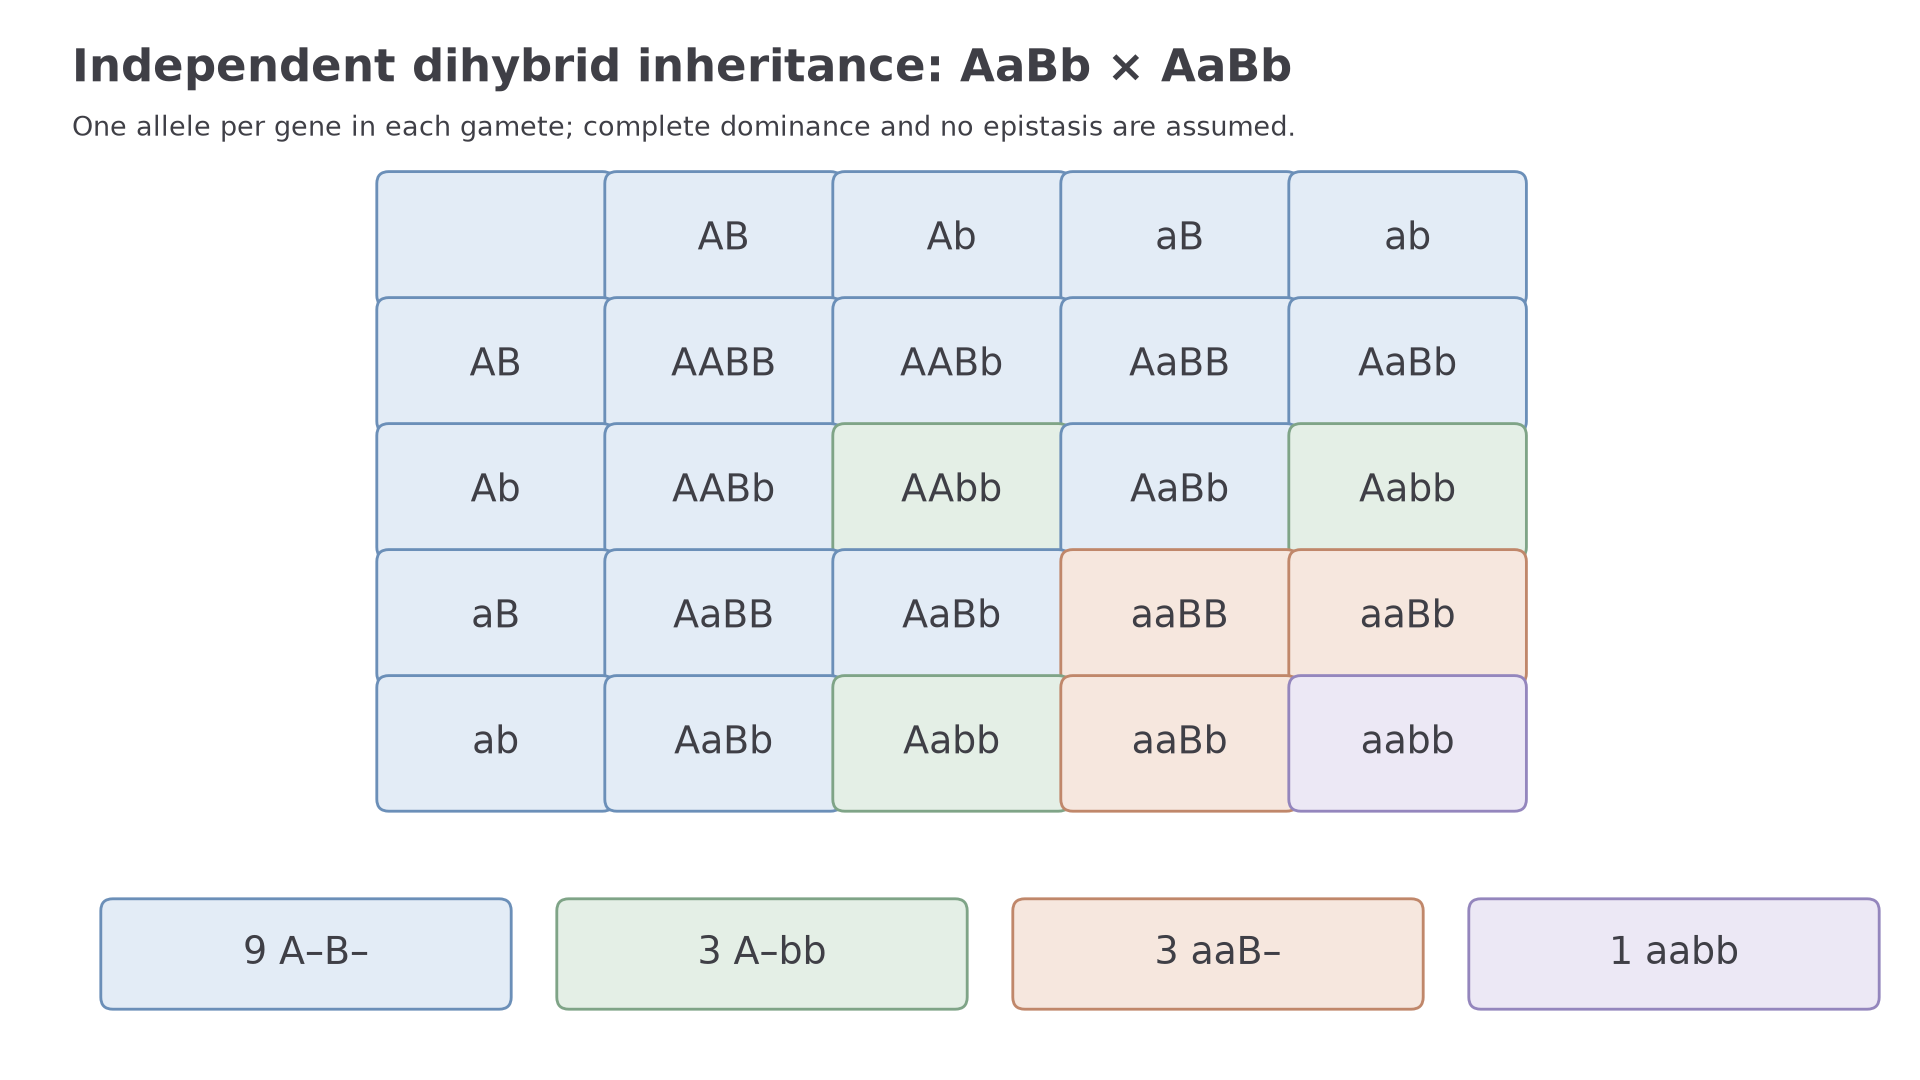
In the cross AaBb × AaBb, the diagram has 16 offspring genotype boxes because each parent can produce four gamete types. If A and B are dominant, the phenotype classes are:
| Phenotype class | Genotype pattern | Number out of 16 |
|---|---|---|
| shows both dominant traits | A-B- | 9 |
| shows A trait only | A-bb | 3 |
| shows B trait only | aaB- | 3 |
| shows both recessive traits | aabb | 1 |
Continue this lesson.
You’re previewing NovaLearn without an account. Create a free account to read the rest.
Create free account