E3.1, E3.5, E7.4 - Trigonometric graphs (Extended)
A rotating arm returns to its starting position after one full turn. How do its height and horizontal position change during that turn? E3.1 and E7.4 connect those changing positions to sine, cosine and tangent graphs, including amplitude and period. E3.5 explains the breaks in the tangent graph.
Sine and cosine
Imagine an arm of length 1 turning anticlockwise from the positive horizontal axis. At angle , its endpoint has coordinates . Above the horizontal axis its height is positive; below it the height is negative. Positions to the left have negative horizontal coordinates. This extends the familiar right-triangle ratios beyond acute angles.
Sine and cosine graphs
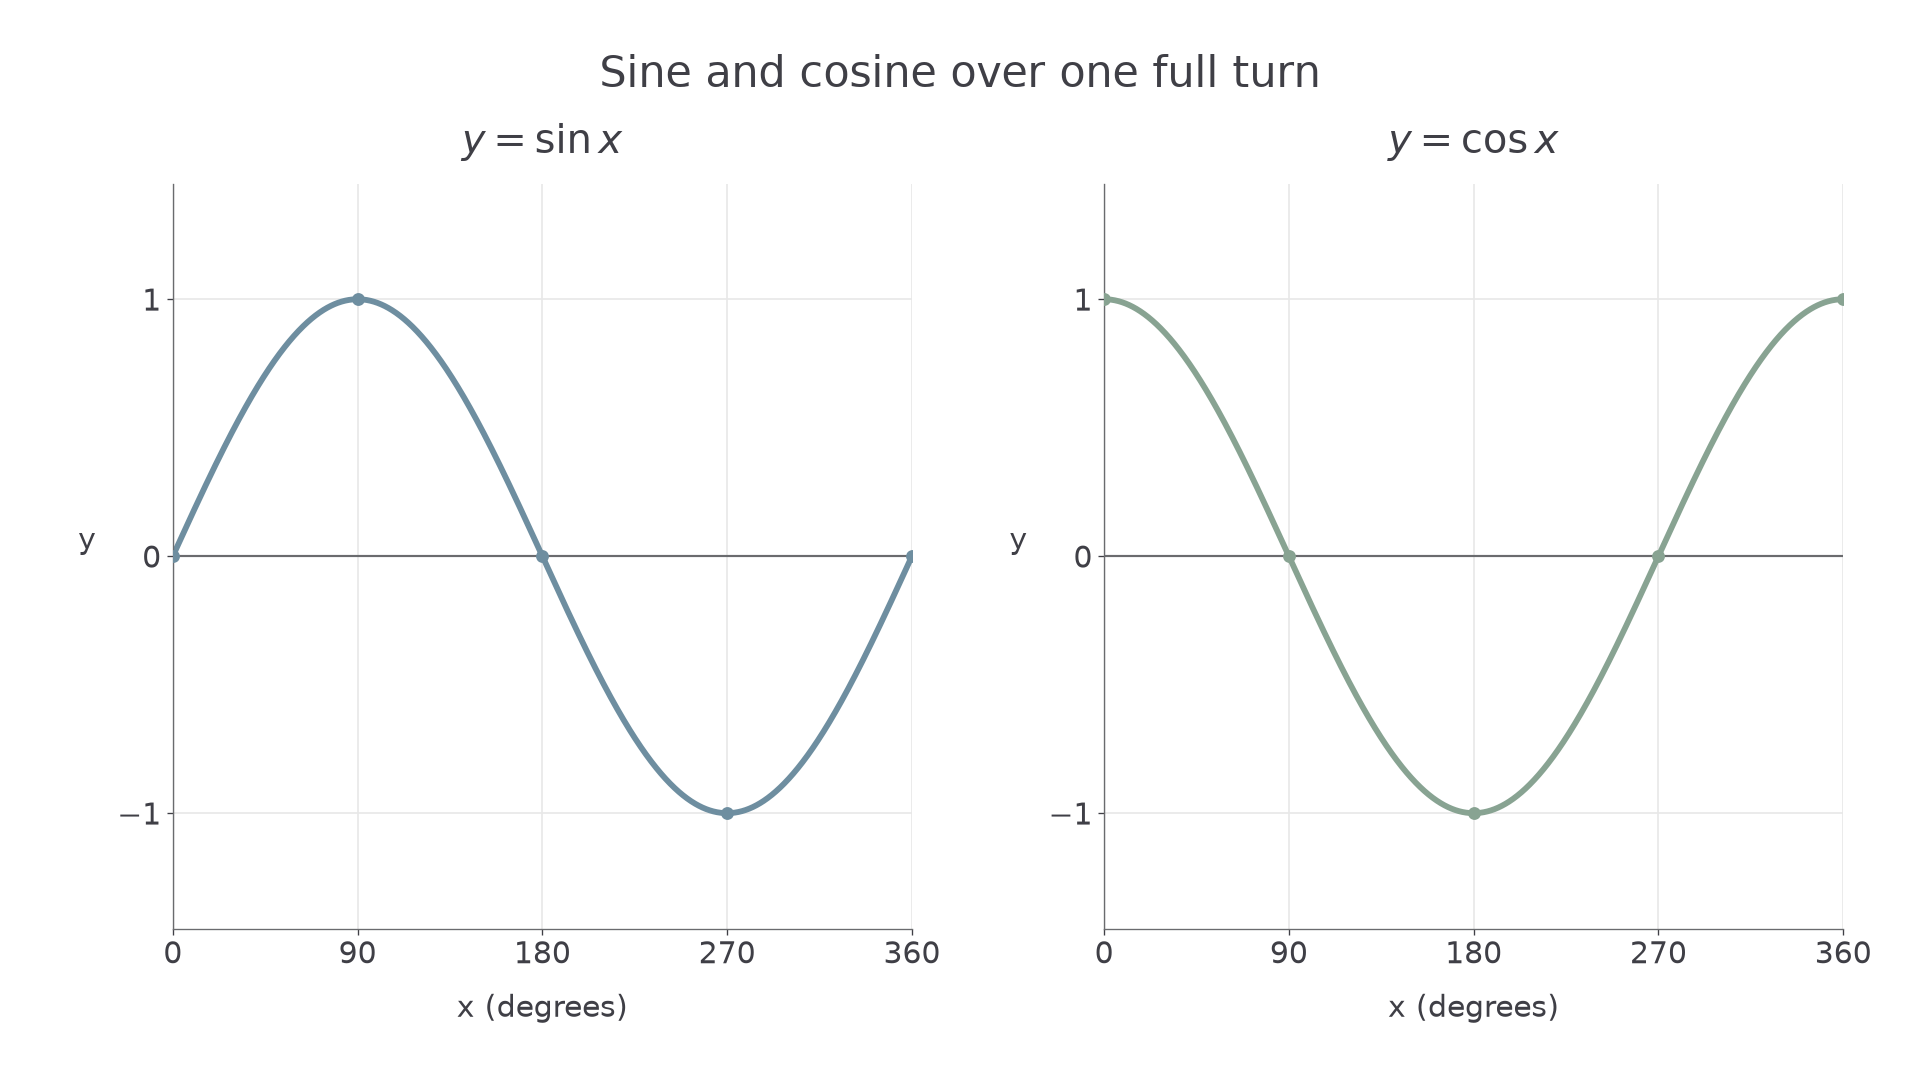
The graph records the vertical coordinate of this rotating endpoint. The graph records its horizontal coordinate. Angles in this lesson are in degrees.
At each quarter turn, the arm is horizontal or vertical. These five positions anchor an entire smooth curve.
| 0 | 1 | 0 | 0 | ||
| 1 | 0 | 0 | 1 |
[DIAGRAM: asset_name: Sine and cosine over one turn; asset_slug: sine_cosine_one_turn; caption: The two graphs use the same scale but start at different heights.; description: Two separate exact coordinate plots on zero to 360 degrees. Sine passes through zero, one, zero, minus one, zero at quarter turns; cosine passes through one, zero, minus one, zero, one. Quarter-turn points, axes and scales are labelled.]
Worked example 1: sketching sine
Question. Describe a sketch of for , stating its zeros, maximum and minimum.
Plan. Place the five quarter-turn points, then join them with the smooth shape traced by the rotating arm's height.
The curve starts at , rises to , falls through to , then rises to . It flattens at its maximum and minimum; it has no sharp corners.
Answer. Zeros: . Maximum: 1 at . Minimum: at .
Check. The endpoint cannot be higher than 1 or lower than , because the arm has length 1. Its height is positive during the upper half-turn and negative during the lower half-turn, matching the sketch.
Change the coordinate being recorded from vertical to horizontal. The quarter-turn angles stay fixed, but the values change.
Worked example 2: sketching cosine
Question. Describe a sketch of on the same interval, stating its zeros, maximum and minimum.
Plan. Track the horizontal position at the five quarter turns.
The curve starts at , falls through to , then rises through to . Join these points smoothly, flattening at the top and bottom.
Answer. Zeros: . Maximum: 1 at both and . Minimum: at .
Check. The arm points furthest left at , so its horizontal coordinate must be . Reflection of the graph in leaves it unchanged: equal angles either side give equal horizontal positions.
Sine has rotational symmetry of order 2 about on this interval. Cosine has a line of symmetry . Both graphs repeat after a full turn.
Watch out
Do not join the quarter-turn points by straight segments. A trigonometric graph is smooth. Include both endpoints when the interval uses .
Use the key positions without drawing a new graph.
Tangent and asymptotes
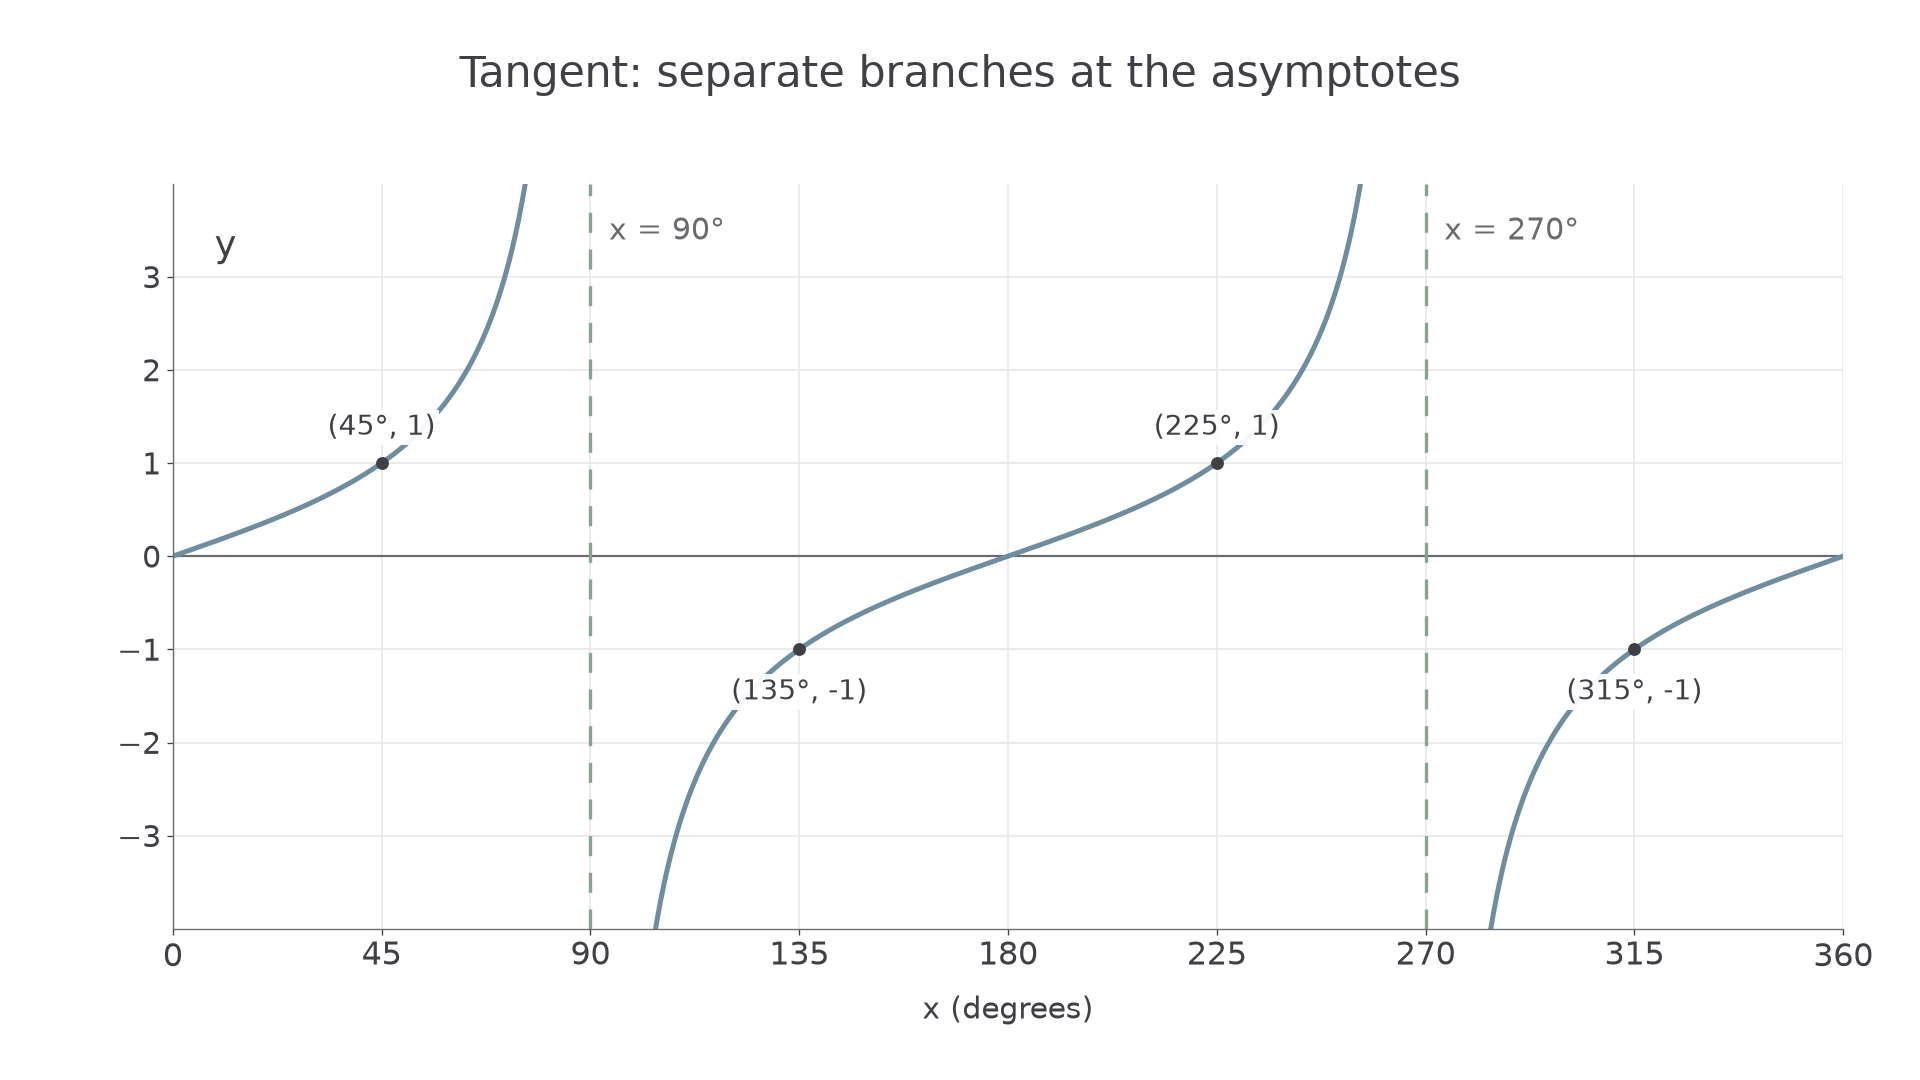
Tangent is , wherever . At and , the cosine is zero, so tangent has no value. Near either angle the ratio can have a very large magnitude; the graph has separate branches.
Vertical asymptote
A vertical asymptote is a vertical line approached by a graph as its values grow without bound in magnitude. For on one full turn, the asymptotes are and . The dashed lines show these positions; they are not parts of the graph.
For example, , but . These are on opposite branches, not endpoints of a line crossing the break.
[DIAGRAM: asset_name: Tangent and its breaks; asset_slug: tangent_one_turn; caption: Draw separate increasing branches and leave breaks at 90 and 270 degrees.; description: Exact tangent graph from zero to 360 degrees with three separate branches, dashed vertical asymptotes at 90 and 270 degrees, zeros at zero, 180 and 360 degrees, and marked values at 45, 135, 225 and 315 degrees. No segment joins across an asymptote.]
Worked example 3: the first tangent branch
Question. Sketch the part of for , showing and the asymptote.
Plan. Use the exact values at 0 and 45 degrees, then show how the branch approaches its break.
gives , and gives . Draw an increasing curve through them, becoming steeper and rising without bound as approaches from the left. Draw dashed.
Answer. One increasing branch through and , approaching the vertical asymptote .
Check. The values at 30 and 60 degrees are and : they lie below and above 1, respectively, as the rising curve requires.
Move to the next branch. Its values start negative just beyond the break, even though the branch is still increasing.
Continue this lesson.
You’re previewing NovaLearn without an account. Create a free account to read the rest.
Create free account