C10.7; E10.7 - Scatter diagrams and lines of best fit
Two quantities can move together without following an exact rule. Can a line through scattered observations still make a useful prediction? C10.7 and E10.7 connect paired points, correlation, a line of best fit through the mean point and the limits of predictions.
Scatter diagrams and correlation
Keep the two measurements from each observation together. If one journey has distance 2 km and fare 6 dollars, its point is ; it must not acquire another journey's fare when a list is reordered.
Scatter diagram and correlation
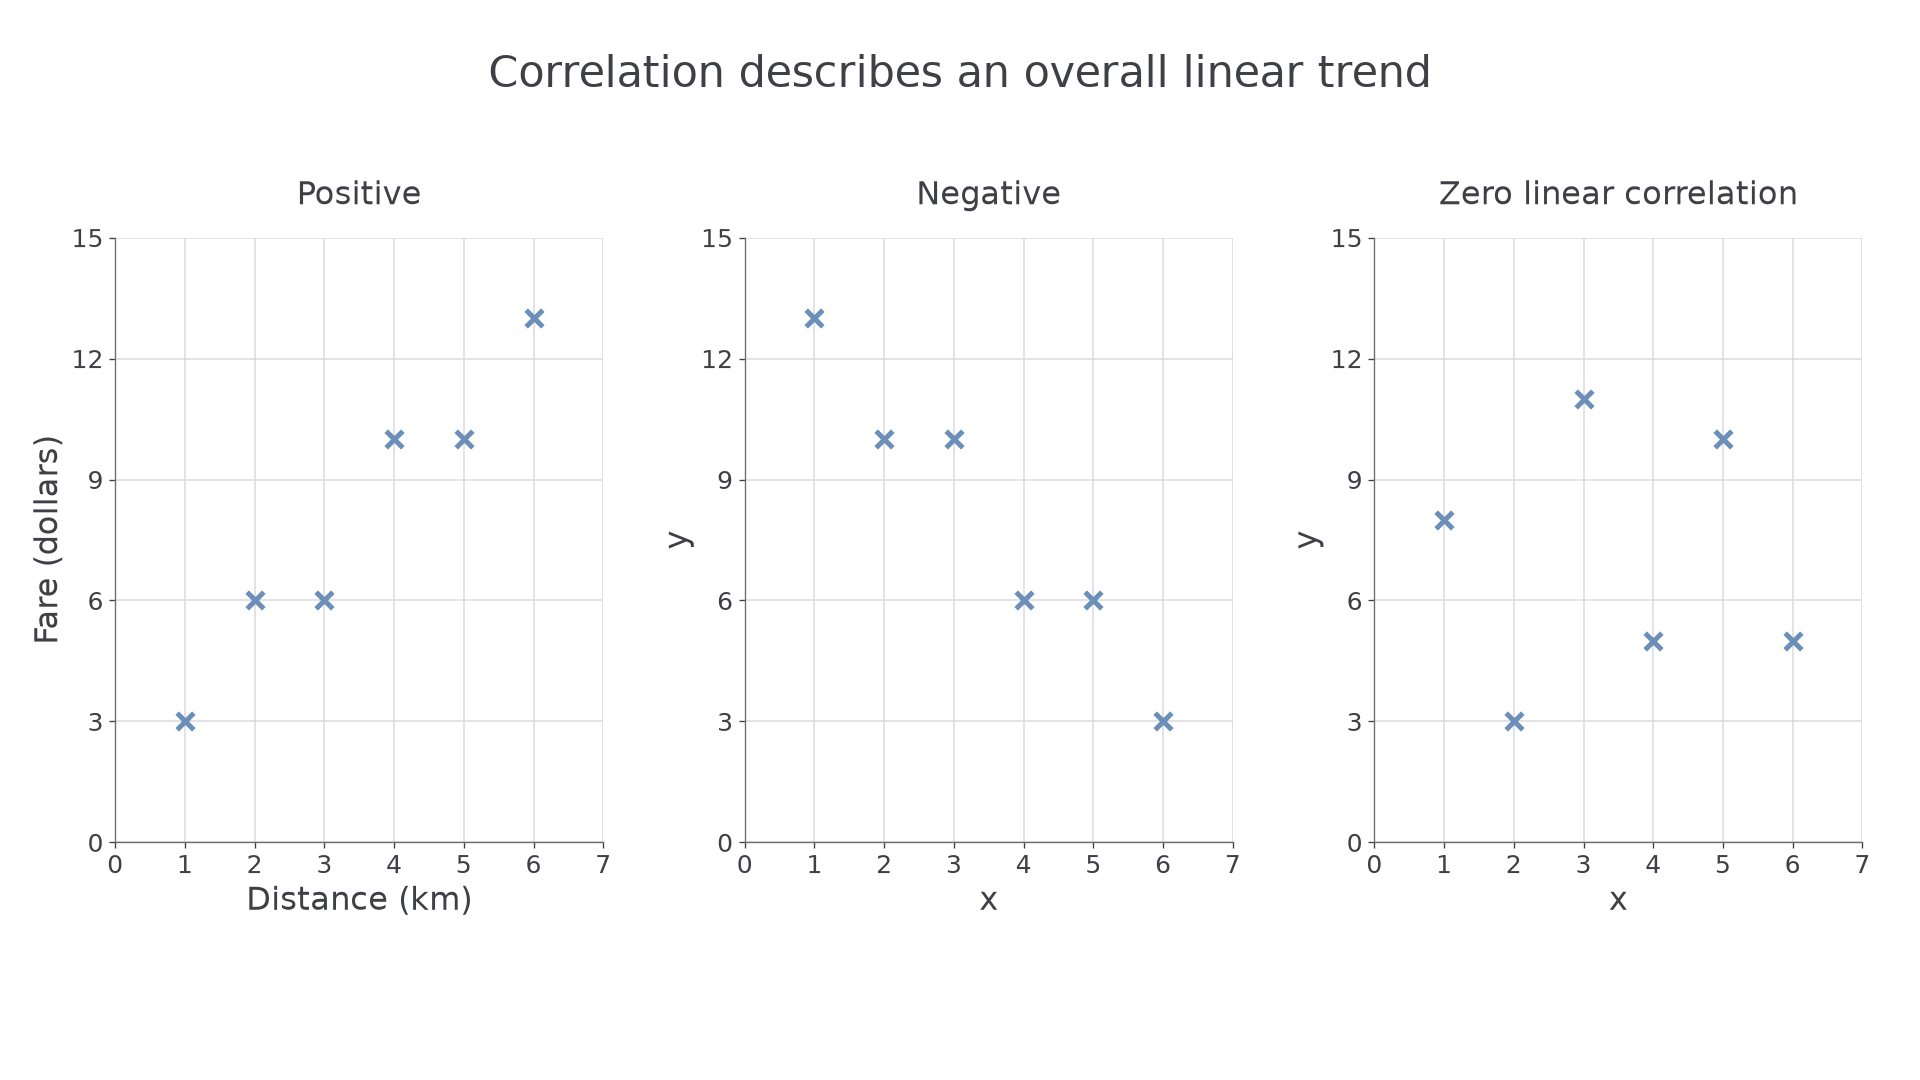
A scatter diagram plots one point for each paired observation. Positive correlation means larger values of one variable tend to accompany larger values of the other; negative correlation means they tend to accompany smaller values. Zero correlation describes no clear straight-line association. A correlation coefficient is not required here.
Label both axes with variables and units, choose regular scales covering all the data, then plot small clear crosses. Scatter points are not joined point to point. Close clustering around a rising or falling line indicates a stronger linear association; a more dispersed cloud indicates a weaker one. An unusual point should be investigated, rather than quietly deleted.
[DIAGRAM: asset_name: Three correlation patterns; asset_slug: scatter_correlation_patterns; caption: A rising pattern is positive, a falling pattern negative, and the third cloud has no clear linear trend.; description: Three equally scaled scatter diagrams use clear crosses. Positive data are (1,3),(2,6),(3,6),(4,10),(5,10),(6,13). Negative data are (1,13),(2,10),(3,10),(4,6),(5,6),(6,3). A third balanced cloud shows zero linear correlation.]
Worked example 1: plotting paired journeys
Question. Plot these journeys and describe the correlation.
| Distance (km) | 1 | 2 | 3 | 4 | 5 | 6 |
|---|---|---|---|---|---|---|
| Fare (dollars) | 3 | 6 | 6 | 10 | 10 | 13 |
Plan. Use distance horizontally, fare vertically, and plot one cross per column.
Use horizontal divisions of 1 km from 0 to 7 and vertical divisions of 1 dollar from 0 to 15. The first crosses are and ; the remaining four follow the paired columns. The left-hand graph shows the result.
Answer. Positive correlation: longer journeys tend to have higher fares.
Check. There are six crosses, including two different distances with fare 6. The two repeated fares must not be collapsed into one point.
The same plotting procedure also handles a falling relationship. Only the direction of the association changes.
Worked example 2: a falling pattern
Question. Plot the pairs and describe their correlation.
Plan. Keep the same scales and mark each pair as a cross.
The middle graph shows all six pairs. Moving from left to right, the cloud falls from around 13 to around 3, although not every successive value falls strictly.
Answer. Negative correlation.
Check. The largest horizontal value pairs with the smallest vertical value. Equal neighbouring vertical values do not remove the overall downward trend.
A pattern need not be perfectly straight to have correlation. Also inspect the whole shape: a curved pattern can be a relationship even when no straight-line trend describes it well.
Interpreting relationships
Describe the variables in the question, rather than only saying “the points go up”. For the journey data, “greater distance tends to accompany a higher fare” connects the picture to its context. “Every longer journey costs more” goes beyond a scattered trend.
Correlation and causation
Correlation is an observed association. Causation means a change in one factor produces a change in another. Paired data alone do not establish that causal link: another factor, a selection effect or chance may explain the association.
Suppose a sample of children shows a positive association between shoe size and reading score. The diagram alone does not show that larger shoes improve reading. Age could affect both quantities. Similarly, a negative association between journey speed and journey time is consistent with a familiar distance relationship, but a diagram without distance information cannot prove that every route had the same length.
Use “tends to”, “in this sample” and the actual variable names when the evidence warrants them. This is precision about what was observed, rather than uncertainty about reading the graph.
Key idea
A scatter diagram supports a description of association. Establishing a cause requires further evidence about the situation and how the data were collected.
Apply that distinction to another sample.
Drawing lines of best fit
A best-fit line summarises a roughly linear cloud. It is one ruled straight line across the full spread of the data, with roughly balanced points on either side over its length. It should pass through the mean point, which may not be one of the observed points.
Continue this lesson.
You’re previewing NovaLearn without an account. Create a free account to read the rest.
Create free account