C10.6; E10.6 - Frequency distributions
A list shows individual observations; a frequency distribution shows where observations are concentrated. C10.6 and E10.6 develop tables and simple diagrams for separate values and clearly defined groups. You will read frequencies using the actual scale and explain what grouping does and does not reveal.
Discrete frequencies
Did most players score around two goals, or did the scores vary widely? Start by counting how often each possible score occurs. Listing the values in numerical order reveals the distribution rather than the order in which the matches happened.
Frequency distribution
A frequency distribution shows each value, category or class together with its frequency. For ungrouped numerical data, each row represents one exact value; a frequency of zero means that value was not observed.
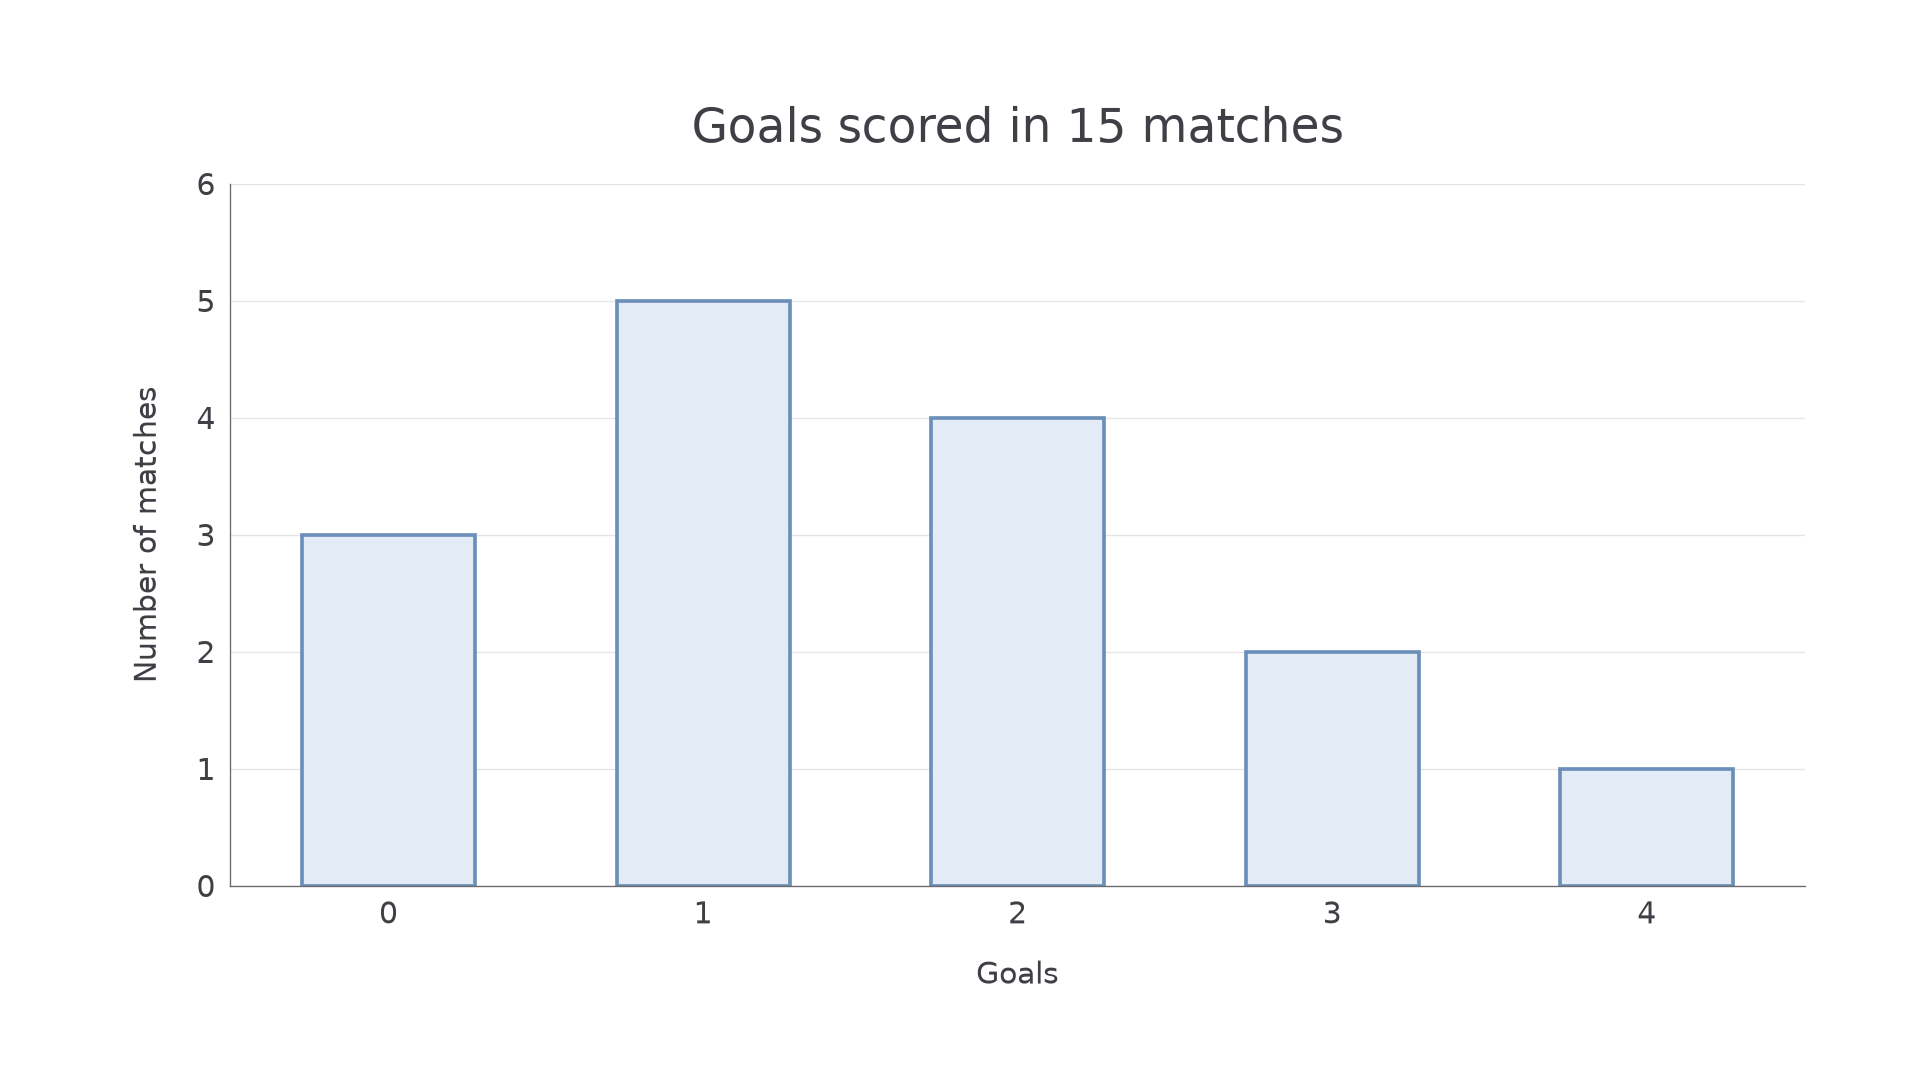
Use an ordered numerical axis for a diagram of separate values. The position of a bar shows the value and its height shows the frequency. Include missing intermediate values with frequency zero so the horizontal scale does not compress a gap in the data.
[DIAGRAM: asset_name: Discrete goal frequencies; asset_slug: goal_distribution; caption: The horizontal axis records goals and the vertical axis records matches.; description: A discrete bar chart has goals zero one two three four on a uniformly spaced horizontal axis. Frequencies are three five four two one respectively. Equal-width separated bars start at zero on a vertical axis labelled Number of matches, with every integer tick from zero to six.]
Worked example 1: values and frequencies
Question. Fifteen matches have goal counts . Make a frequency distribution and draw a simple bar diagram.
Plan. Count each integer from 0 to 4, then put the counts at the corresponding positions.
| Goals | 0 | 1 | 2 | 3 | 4 |
|---|---|---|---|---|---|
| Frequency | 3 | 5 | 4 | 2 | 1 |
Draw the bar heights , as shown above.
Answer. The table and diagram show the distribution.
Check. , matching the number of matches. The five matches with one goal make the tallest bar, even though 1 is not the largest goal count.
The next distribution includes a missing intermediate value. Its place on the axis remains even though no bar rises there.
Worked example 2: zero frequency
Question. Seven boxes contain damaged items. Tabulate the distribution for 0 to 4 damaged items and describe the bar at 3.
Plan. Count all stated values, including the unobserved integer between 2 and 4.
| Damaged items | 0 | 1 | 2 | 3 | 4 |
|---|---|---|---|---|---|
| Frequency | 2 | 2 | 2 | 0 | 1 |
Answer. Frequencies ; at 3 the bar has zero height.
Check. The frequencies total 7. Keeping 3 on the axis ensures the horizontal distance from 2 to 4 is twice the distance from 1 to 2.
A frequency of zero and a value of zero are different. Two boxes have zero damaged items, so the row for value zero has frequency 2.
Watch out
Do not swap the axes' meanings. A bar at value 4 with height 1 means one observation of 4, not four observations of 1.
Use the whole stated range in the next table.
Grouped distributions
When many distinct measurements occur, grouping makes their overall pattern easier to see. The price is lost detail: a class frequency tells you how many values lie inside an interval, but not their individual positions.
Class interval
A class interval is a stated range of values collected into one group. Classes should cover the intended range without overlaps. For example, includes 0 but excludes 5; the next class includes 5.
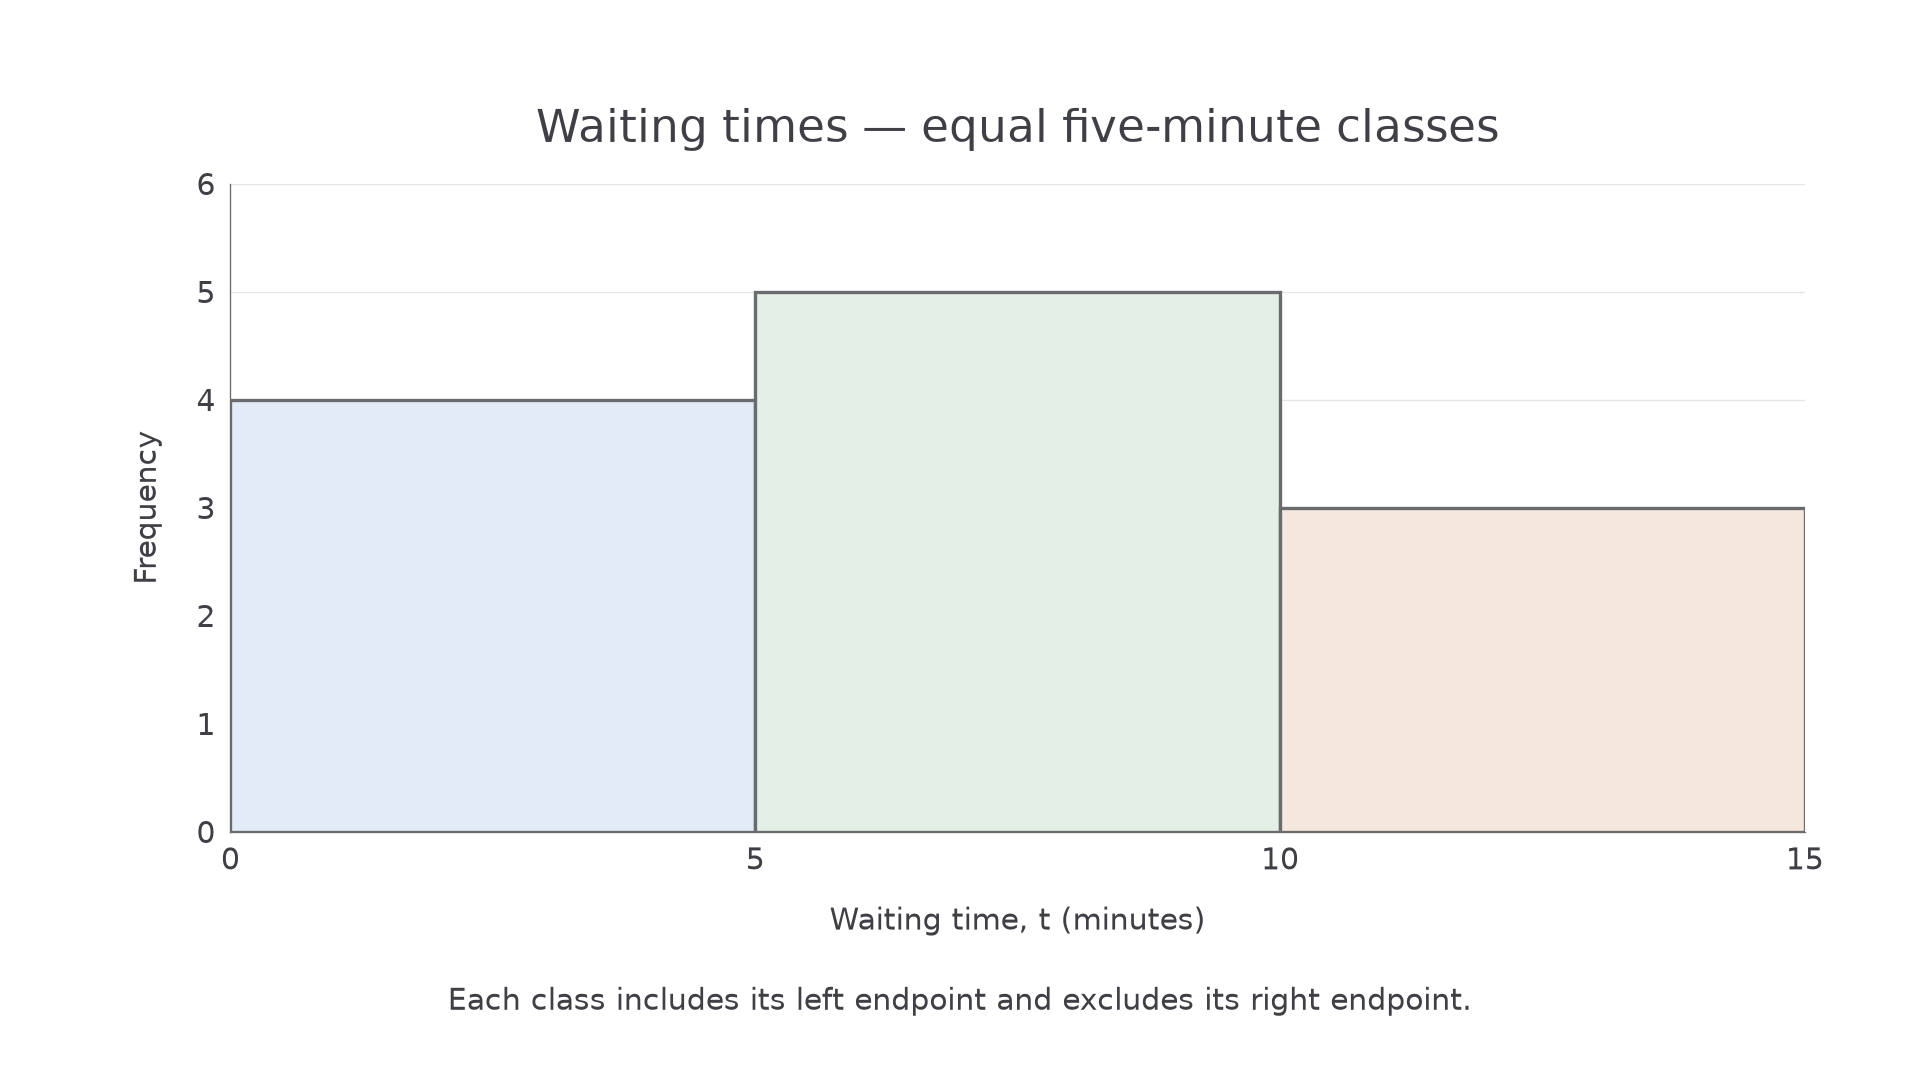
For a discrete count, classes such as 0–2, 3–5 and 6–8 mean inclusive whole-number groups. For continuous data, avoid a gap between 2 and 3: use adjoining boundaries with clear inequalities. This part uses equal-width classes, so heights can represent frequencies directly. Label the vertical axis “Frequency” and state the interval boundaries or complete class labels. No frequency-density calculation is needed here.
[DIAGRAM: asset_name: Grouped waiting times; asset_slug: grouped_waits; caption: Equal five-minute intervals contain four, five and three waits.; description: A simple frequency diagram for waiting time t in minutes has adjoining equal-width intervals zero to five, five to ten and ten to fifteen on the horizontal axis. Bar heights are four five three. The vertical axis is Frequency with integer ticks zero to six. A note states left endpoints included and right endpoints excluded. The endpoint fifteen is not included in the recorded classes.]
Worked example 3: placing boundary values
Question. Group the waiting times minutes into , and . Draw a simple frequency diagram.
Plan. Test each value against the class inequalities, then draw equal-width intervals with the resulting frequencies.
| Time , minutes | Frequency |
|---|---|
| 4 | |
| 5 | |
| 3 |
The value 5 enters the second class and 10 enters the third. The diagram above has these three heights.
Answer. The frequencies are 4, 5 and 3.
Check. . Every boundary observation enters once: neither 5 nor 10 is counted in two groups.
Continue this lesson.
You’re previewing NovaLearn without an account. Create a free account to read the rest.
Create free account