E10.4 - Grouped averages (Extended)
A table says that eight journeys lasted between 10 and 20 minutes, but it does not give their individual times. How can you estimate their contribution to an average? E10.4 uses class midpoints to estimate a grouped mean and identifies the modal class without pretending the original measurements are known.
Class midpoints
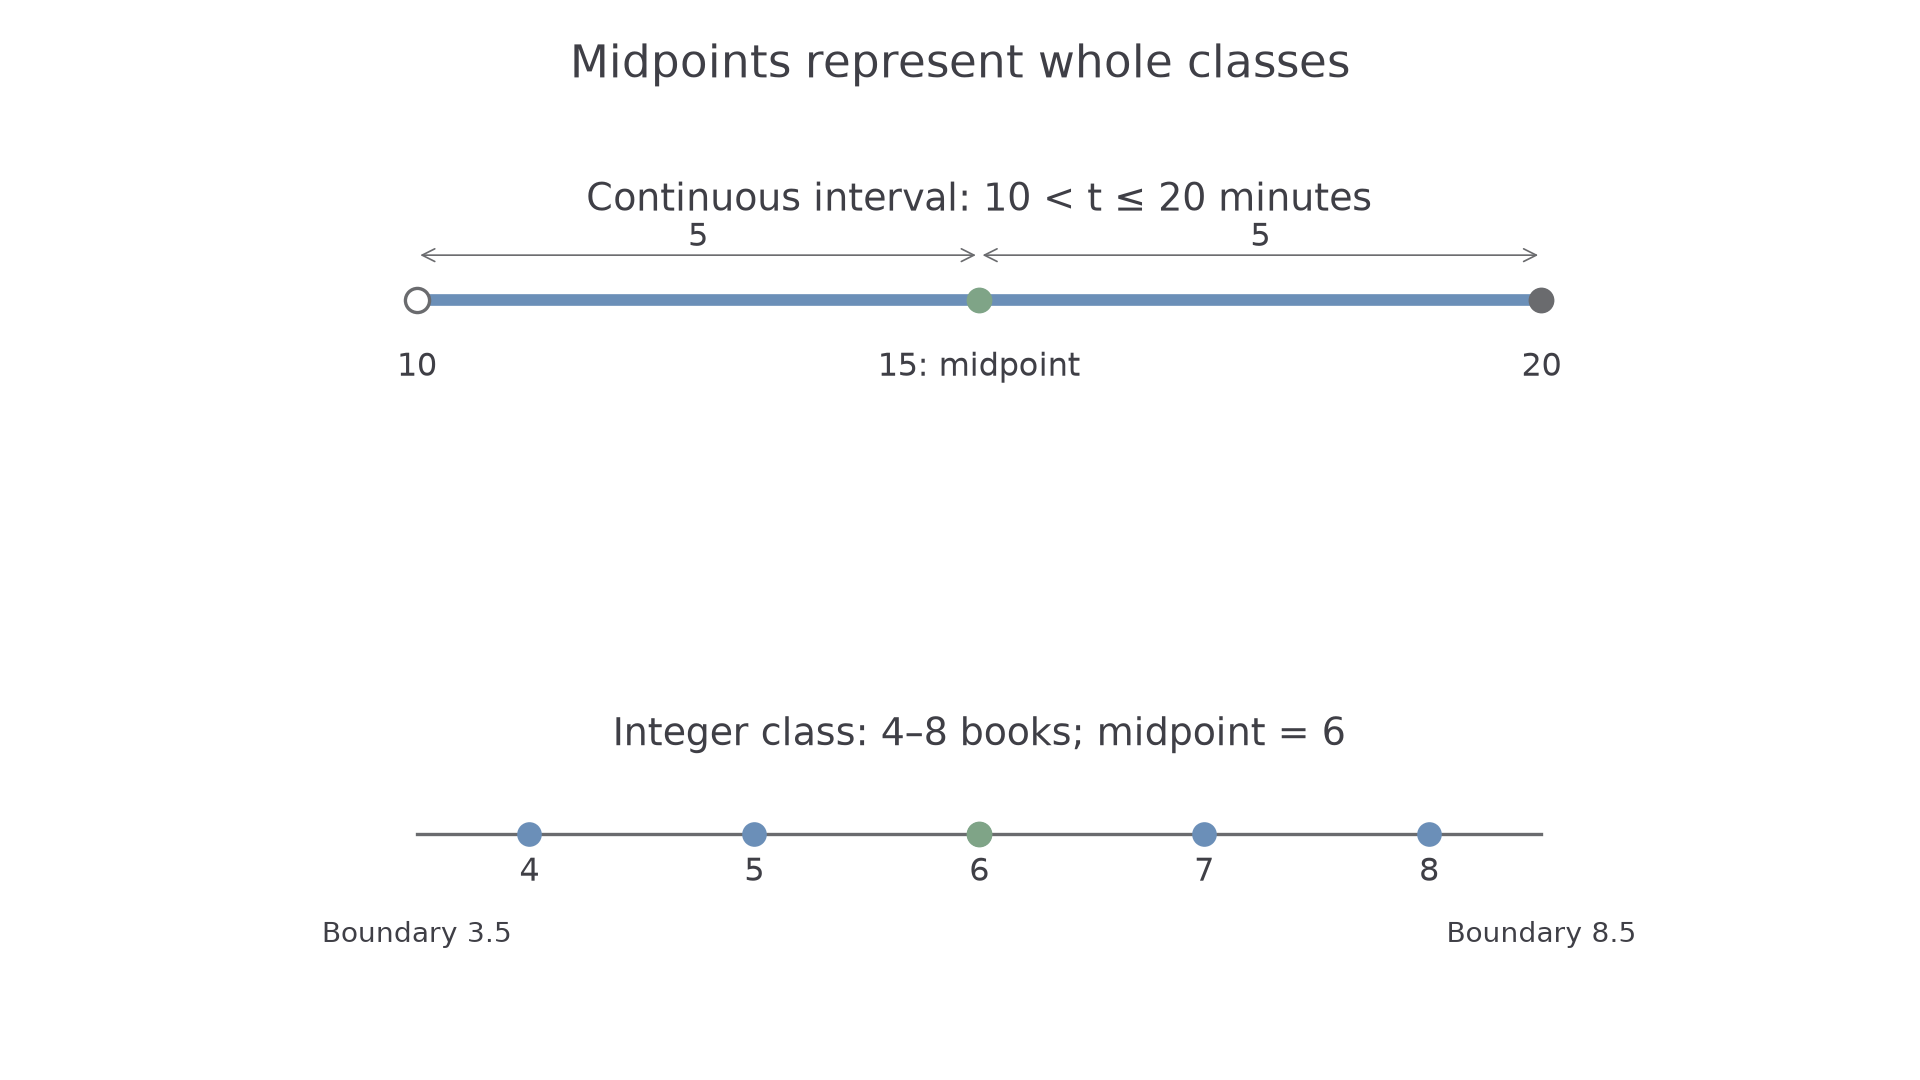
Grouping saves space but loses information: a journey in the interval minutes might last 11 minutes or 19 minutes. Use 15 minutes as a representative value because it lies halfway between the boundaries.
Class midpoint
The class midpoint is halfway between the two class boundaries. It represents every observation in that class when estimating a grouped mean; it need not be an observed value.
Find the halfway value by adding the endpoints and dividing by 2. For an integer-valued class such as 4–8, its midpoint is also halfway between its smallest and largest possible values. The boundaries 3.5 and 8.5 give the same result.
[DIAGRAM: asset_name: Midpoints represent whole classes; asset_slug: grouped_midpoints; caption: Each midpoint represents all the values in its class.; description: A continuous interval from 10 to 20 with midpoint 15, and integer values 4 to 8 with midpoint 6. Boundary inclusion and the representative midpoint are labelled separately.]
Worked example 1: continuous classes
Question. Find the midpoints for journey times , and minutes.
Plan. Average the two boundaries of each class separately.
The last class is wider, so its midpoint is 30, rather than continuing the earlier step of 10.
Answer. 5, 15 and 30 minutes.
Check. 30 is 10 minutes from each of 20 and 40; each other midpoint is equally far from its own boundaries too.
The next table groups whole-number counts. A representative value can still be a half-integer even when no observation is a half-integer.
Worked example 2: grouped discrete data
Question. Numbers of books read are grouped as 0–3, 4–7 and 8–11. Find the class midpoints.
Plan. Average the smallest and largest integers in each group.
Answer. 1.5, 5.5 and 9.5 books.
Check. The first class contains 0, 1, 2 and 3; their average is . This is a representative count, not a claim that someone read half a book.
The inequality signs decide which class contains a boundary observation. They do not change the halfway calculation.
Estimated mean
If eight journeys are represented by 15 minutes each, their estimated total time is minutes. Multiply each midpoint by its frequency, add these estimated totals, then divide by the number of observations.
Estimated grouped mean
Here is a class midpoint, its frequency, and means “add all the entries”. The total frequency must be positive. This formula is not supplied in the formula lists for Papers 1–4: learn the method.
The estimate treats all observations as if they were at their class midpoints. Their actual positions are unknown, so the exact mean usually cannot be recovered.
Worked example 3: estimating a mean time
Question. Estimate the mean journey time.
| Time (minutes) | Frequency | Midpoint | |
|---|---|---|---|
| 4 | 5 | 20 | |
| 8 | 15 | 120 | |
| 3 | 30 | 90 |
Plan. Add the estimated class totals and divide by all 15 journeys.
Answer. 15.3 minutes to 3 significant figures.
Check. Using 15 minutes as a reference, the first class contributes and the last contributes . The net 5 minutes above gives , independently confirming the result.
Continue this lesson.
You’re previewing NovaLearn without an account. Create a free account to read the rest.
Create free account