C3.1; E3.1 - Linear and quadratic graph shapes
Two graphs pass through . Must they have the same shape? C3.1 and E3.1 distinguish straight-line and quadratic functions, then use a graph to read an output or find the inputs giving a specified output.
Linear graphs
The rule gives outputs 1, 3 and 5 for inputs 0, 1 and 2. Equal increases in the input give equal increases in the output, so its graph is straight. The rule gives 1, 2 and 5 at those inputs; its changing increase produces a curve.
Linear function
A function of the form has a straight-line graph. For the graph rises from left to right; for it falls; for it is the horizontal constant graph . The point is its -intercept.
A vertical line is a straight line but is not the graph of a function assigning a single to each : one input would have many outputs. The phrase “linear function” here concerns .
[DIAGRAM: asset_name: Rising falling and constant linear functions; asset_slug: graph_shapes_linear; caption: The coefficient of x controls whether a straight graph rises, falls or stays horizontal.; description: Three separate accurately scaled coordinate grids show y equals two x plus one, y equals minus two x plus one and y equals one. Each equation is printed above its own graph and the common intercept zero comma one is marked. The two sloping lines rise and fall respectively, while the third line is horizontal.]
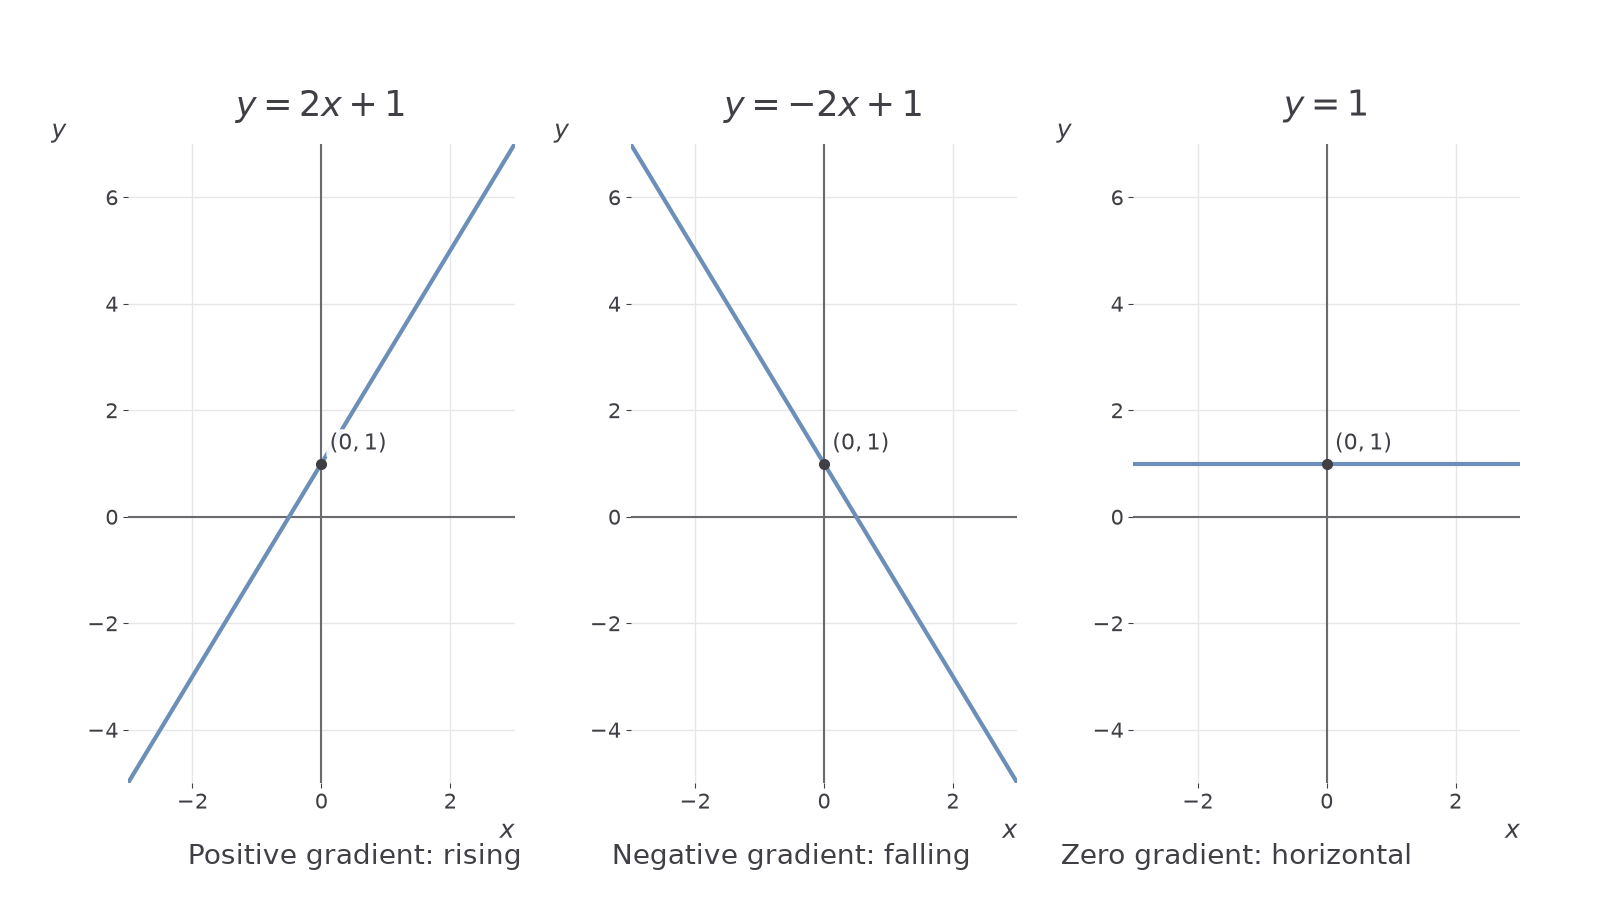
Worked example 1: a rising line
Question. Describe the graph of , including its direction and -intercept.
Plan. Read the sign of the -coefficient and set for the intercept.
Answer. A straight line rising from left to right, with -intercept .
Check. , which is 3 higher than , agreeing with a rising straight line of gradient 3.
Change only the gradient's sign. The intercept stays in the same place.
Worked example 2: a falling line
Question. Describe the graph of , including its direction and -intercept.
Plan. Use the negative coefficient to decide the direction, then evaluate at zero.
Answer. A straight line falling from left to right, with -intercept .
Check. , which is 3 lower than , matching the negative gradient.
The intercept alone cannot distinguish a line from a curve. Check the whole shape and the direction as well as where it crosses an axis.
Watch out
A negative intercept does not imply a falling graph. The first example rises even though it crosses the -axis below the origin.
Identify the shape using both coefficients.
Quadratic graphs
Squaring and 2 gives the same result. This repeated pairing makes symmetric about the -axis, with its lowest point at the origin. Adding a linear term can move the line of symmetry, but the quadratic curve still has one turning point.
Quadratic graph and vertex
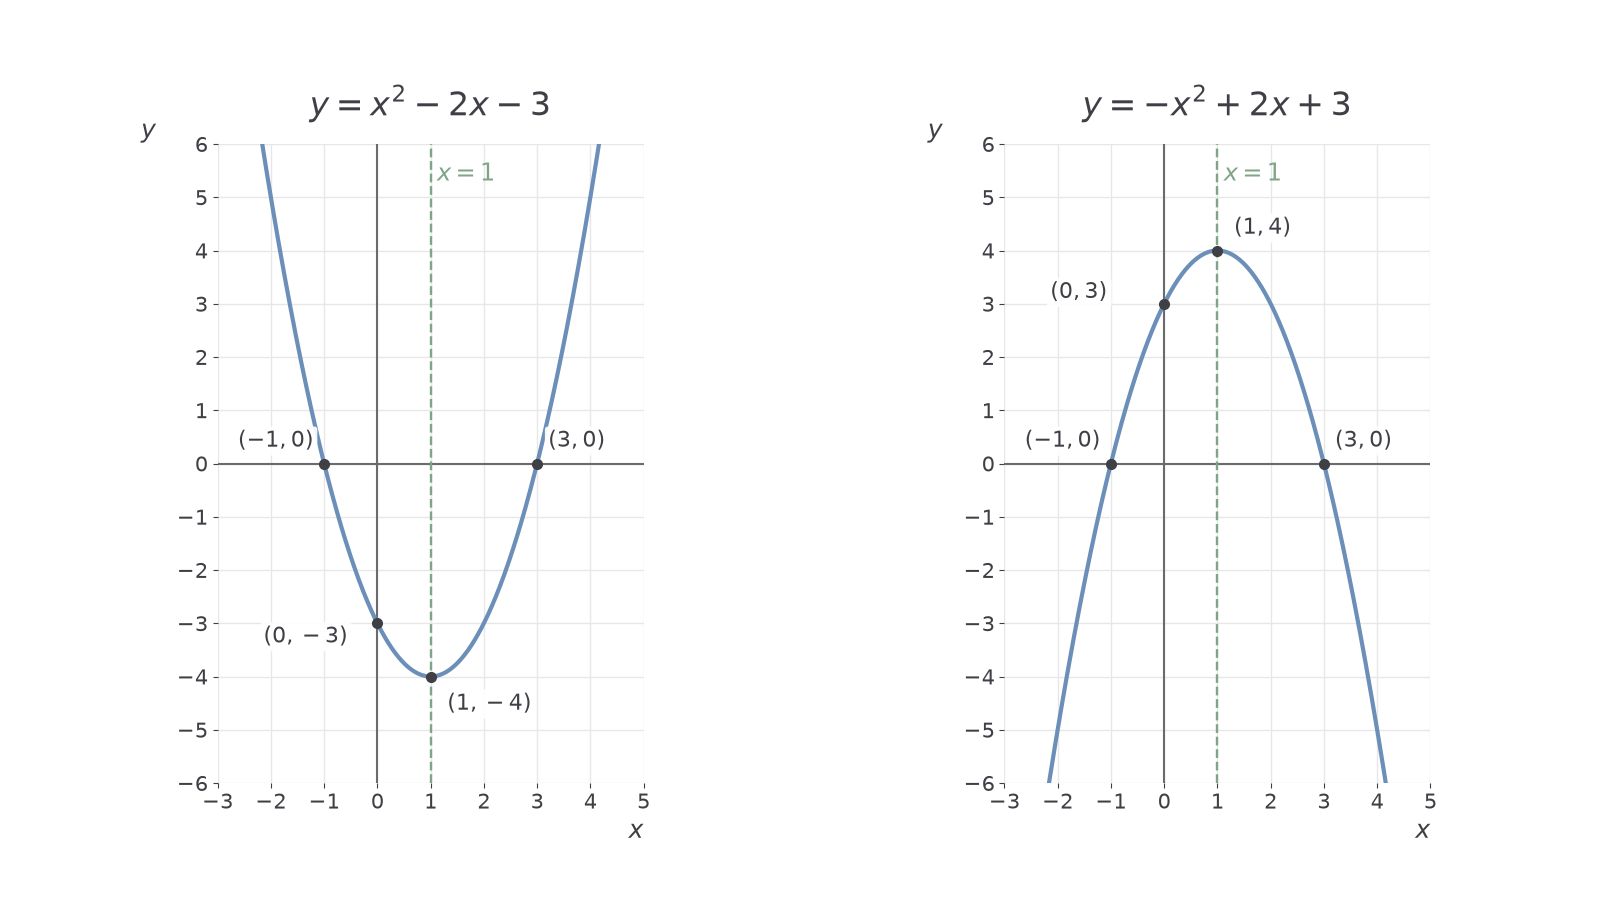
A quadratic function has the form , where . Its graph is a parabola. Its vertex is the turning point: a minimum when and a maximum when . A vertical line through the vertex is a line of symmetry.
The sign of decides whether the curve opens upwards or downwards. It does not decide whether the whole curve is above or below the -axis. The constant gives the -intercept, which need not be the vertex.
[DIAGRAM: asset_name: Quadratic vertices and symmetry; asset_slug: graph_shapes_quadratic; caption: Both curves turn at x equals 1, but one vertex is a minimum and the other a maximum.; description: Two equal-scale coordinate grids show y equals x squared minus two x minus three and y equals minus x squared plus two x plus three. The first vertex is labelled one comma minus four and its intercepts are minus one comma zero, three comma zero and zero comma minus three. The second vertex is one comma four with intercepts minus one comma zero, three comma zero and zero comma three. Dashed vertical lines through x equals one mark the lines of symmetry.]
Continue this lesson.
You’re previewing NovaLearn without an account. Create a free account to read the rest.
Create free account