C10.4; E10.4 - Quartiles and measures of spread
Two sets of times can have the same median while one set is much less consistent. C10.4 and E10.4 use the range, quartiles and interquartile range to describe spread as well as centre. The hand calculations here use individual values or ungrouped frequency tables.
Range
If two groups both have median 15 minutes, does that make their times equally consistent? No: a middle value says nothing about the distance between the smallest and greatest values. The range supplies that distance.
Range
The range is the greatest observation minus the least observation. It is a non-negative measure of spread and has the same units as the data.
Only the two extreme observations enter the calculation. Other values can change without altering the range. If all observations are equal, the range is zero. A large range may be caused by just one unusually high or low value.
Worked example 1: positive times
Question. Five tasks take minutes. Find the range.
Plan. Identify the greatest and least times, then subtract in that order.
Answer. 8 minutes.
Check. Moving from 12 to 20 takes eight one-minute steps. The answer is a difference, not the largest time, 20.
Now the observations cross zero. The meaning stays greatest minus least; subtracting a negative requires particular care.
Worked example 2: a negative minimum
Question. Four recorded temperatures are degrees Celsius. Find their range.
Plan. Use 4 as the greatest temperature and as the least.
Answer. .
Check. The temperature difference is 5 degrees from to zero and 4 more to 4: . A negative range would contradict a distance between extremes.
Use the actual observed extremes. In an exact frequency table, a row with frequency zero is not an observation and must not set the range.
Watch out
The range is one number, not the interval “12 to 20”, and not . Complete the subtraction when asked to calculate it.
Keep the signed minimum in brackets.
Quartiles
Quartiles describe positions within the ordered data rather than only the extremes. The median divides the data into lower and upper halves; the lower and upper quartiles locate the centres of those halves.
Quartiles
The lower quartile, , is a value marking the lower quarter of an ordered dataset. The median, , marks its centre. The upper quartile, , marks the upper quarter. For the hand method used here, take the medians of the lower and upper halves; when the total count is odd, leave the overall median out of both halves.
A finite list does not always split into four whole-number groups. That is why a quartile can lie between observations, and why calculators can use different conventions. Follow a convention explicitly given in a question. If asked for a GDC quartile, use its statistics output and its convention rather than substituting a different hand rule. The data below deliberately have repeated values around the relevant positions so the common conventions agree.
[DIAGRAM: asset_name: Quartiles of an ordered list; asset_slug: ordered_quartiles; caption: Find the median of each half as well as the median of the whole list.; description: An ordered row of eight equally spaced cards reads two four four six six nine nine twelve. A lower brace covers the first four cards and an upper brace the last four. Lower quartile four is shown between the second and third cards, median six between the fourth and fifth, and upper quartile nine between the sixth and seventh. Labels distinguish positions from data values.]
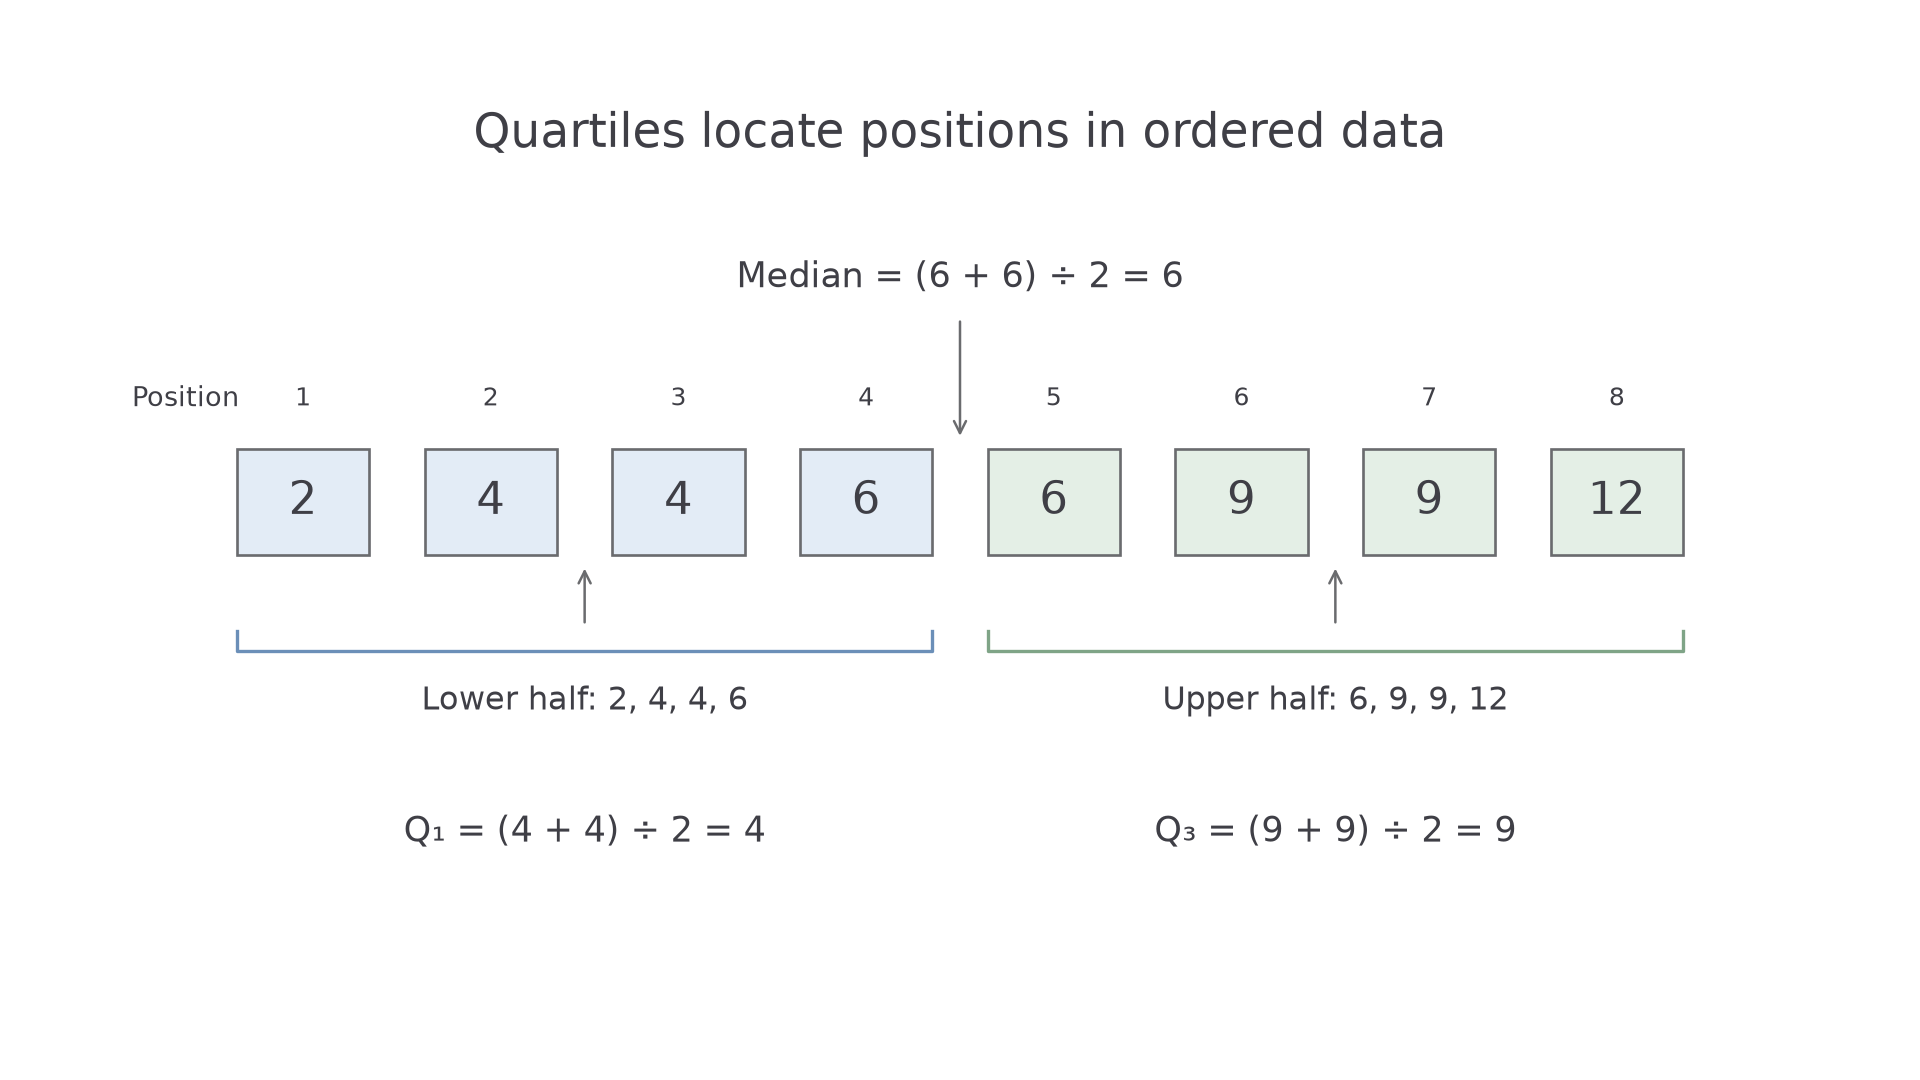
Worked example 3: an even number of values
Question. Find the median and quartiles of .
Plan. Split the eight ordered values into two groups of four, then find the middle pair in each required group.
Answer. , median , .
Check. The ordered relationship is , from minimum through quartiles to maximum. Recounting the two halves gives four observations in each.
Add one extra copy of the median and present the observations as exact frequencies. The total becomes odd, so set aside the single central observation before finding the half-medians.
Continue this lesson.
You’re previewing NovaLearn without an account. Create a free account to read the rest.
Create free account