C10.2, C10.6; E10.2, E10.6 - Bar charts and pictograms
A chart should make a comparison easier, but a missing scale or key can change its meaning. C10.6 and E10.6 develop ordinary, composite and dual bar charts and pictograms. C10.2 and E10.2 use their labels, scales and keys to recover counts and make supported comparisons.
Bar charts
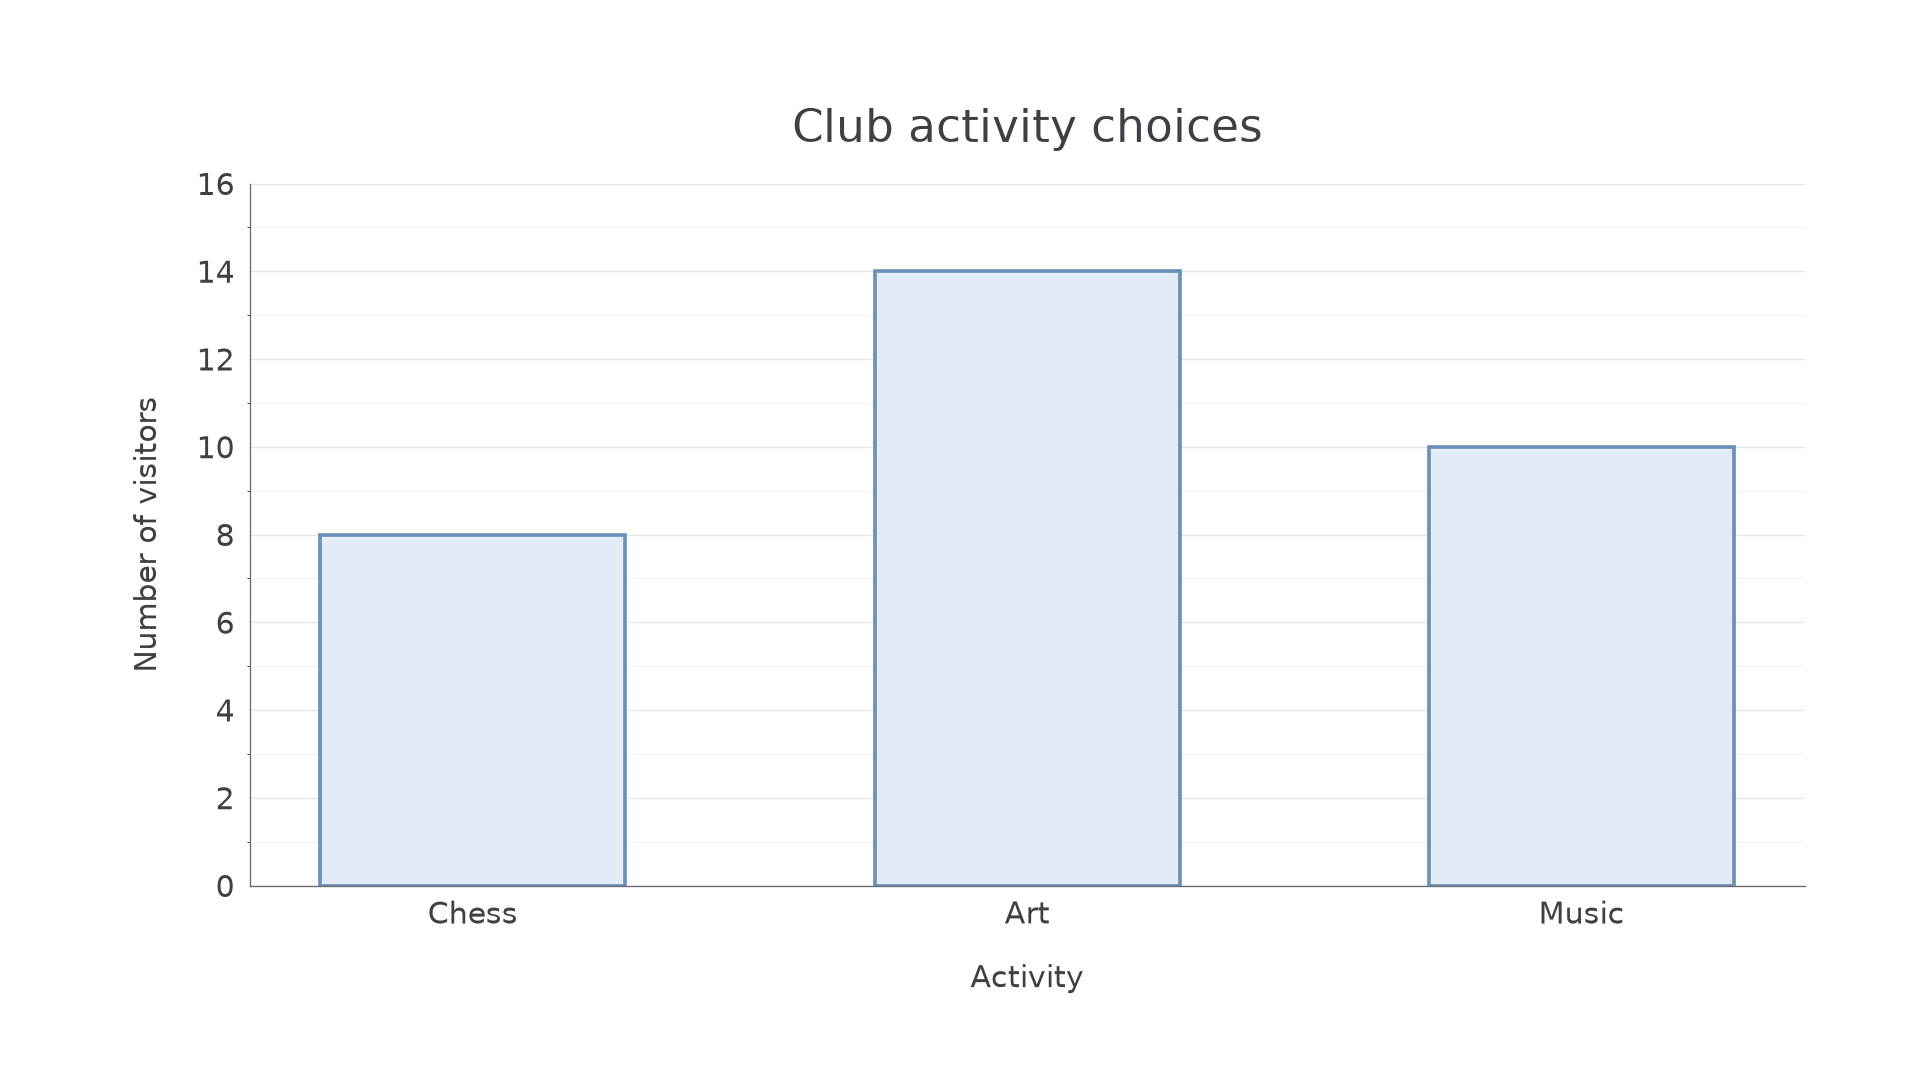
Which activity attracted most visitors, and by how many? A bar chart makes categories easy to compare because every bar starts from the same baseline and its height represents a frequency.
Bar chart
A bar chart represents categories or separate numerical values using equal-width bars with gaps. One axis identifies the categories or values; the other has a uniform frequency scale, normally starting at zero.
Choose a scale that includes the greatest frequency and is easy to subdivide. Label both axes, include a title or clear description, and draw bars with equal widths and consistent gaps. The height carries the count; increasing a bar's width must not make its category seem more important.
[DIAGRAM: asset_name: Activity bar chart; asset_slug: activity_bars; caption: Equal-width bars share a zero baseline and a frequency scale in twos.; description: A bar chart of club choices with Chess eight, Art fourteen and Music ten. The vertical axis is labelled Number of visitors, with labelled ticks zero to sixteen in twos and finer grid lines at every integer. Bars have equal widths and gaps. The horizontal axis is labelled Activity.]
Worked example 1: drawing bars from a table
Question. Visitors choose chess, art or music with frequencies 8, 14 and 10. Draw a bar chart.
Plan. Put the three categories along the horizontal axis and choose a vertical scale reaching at least 14.
Use a scale of 2 visitors per labelled interval, with each interval split into two equal spaces. Draw equal-width bars at heights 8, 14 and 10. Label the vertical axis “Number of visitors” and the horizontal axis “Activity”, as in the chart.
Answer. The chart shown has the required heights and labels.
Check. The bar tops read 8, 14 and 10 from the axis. Their total is , matching the table total.
The next chart keeps the same scale but includes a height halfway between labelled ticks. Read the subdivisions rather than rounding to a labelled value.
Worked example 2: reading an intermediate height
Question. A bar chart has labelled frequency ticks 0, 4, 8, 12 and 16, with four equal small spaces between neighbouring labelled ticks. A cycling bar reaches the third small line above 8; a walking bar reaches 8. How many more people cycle than walk?
Plan. Calculate the value of one small space, read the cycling height, then subtract.
Answer. 3 more people cycle.
Check. Cycling lies between 8 and 12, so its advantage must be between 0 and 4. A difference of 3 fits.
A shortened vertical axis can exaggerate a comparison. Always use the printed numbers, and inspect any break in the scale before comparing visual heights.
Watch out
Count intervals, not grid lines. Four equal spaces from 8 to 12 represent one person per space, not four people per space.
The scale information is supplied completely in this reading task.
Composite and dual bars
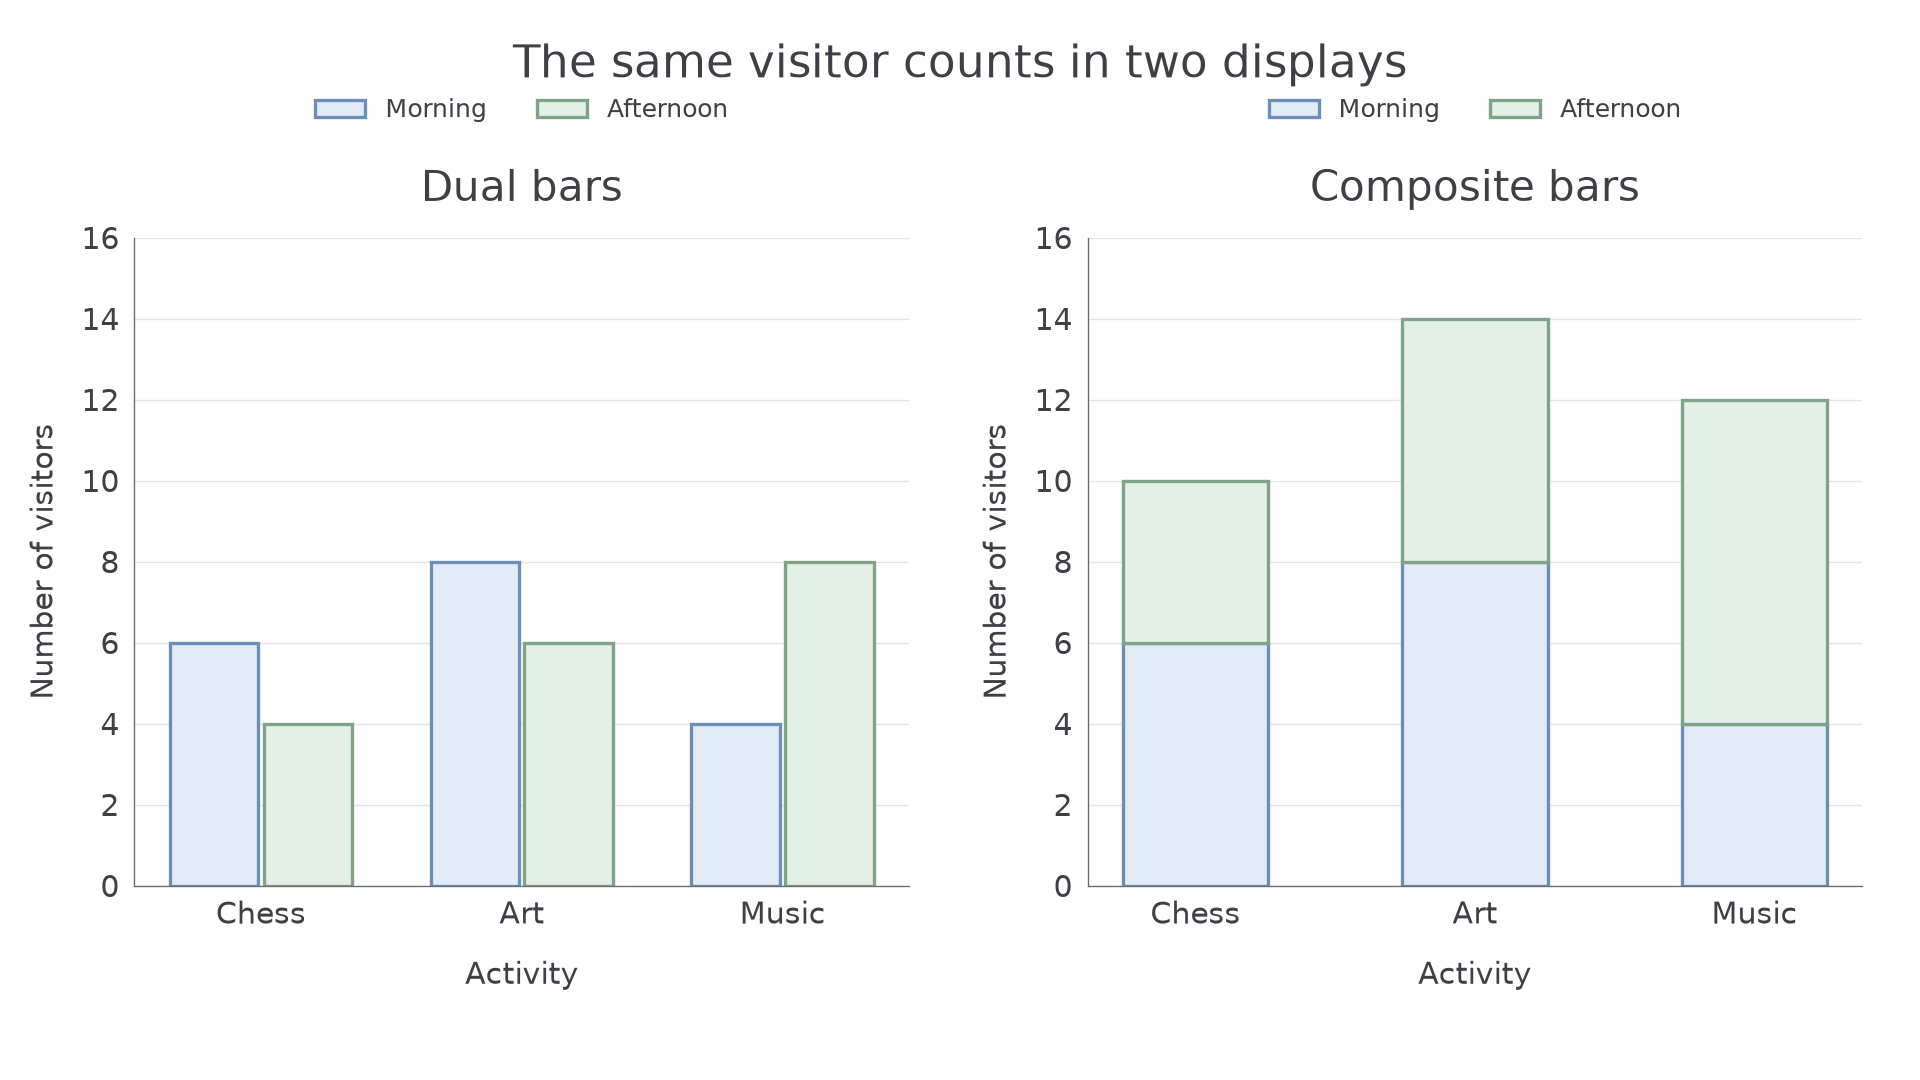
To compare two series, such as morning and afternoon visitors, keep one frequency scale and use a key. A dual bar chart puts the two bars side by side for each category. A composite bar chart stacks the two parts into one bar, so the total is visible immediately.
Dual and composite bars
In a dual chart, each bar height gives one series' frequency. In a composite chart, a section's frequency is its thickness: subtract its bottom reading from its top reading. The top of the complete stacked bar gives the total.
Choose a consistent series order and identify both using the key. Side-by-side bars help compare one series between categories; stacked bars help compare totals and how each total is divided.
[DIAGRAM: asset_name: Dual and composite visitor charts; asset_slug: dual_and_composite_bars; caption: The same morning and afternoon counts appear side by side and stacked.; description: Two panels use the same data. Chess morning six afternoon four, Art morning eight afternoon six, Music morning four afternoon eight. Blue means Morning and sage means Afternoon in both keys. The left panel has paired equal-width bars on a frequency scale zero to sixteen. The right has equal-width stacks with totals ten fourteen twelve. All axes and categories are labelled.]
Worked example 3: comparing series in dual bars
Question. Draw dual bars for morning and afternoon visitors: chess 6 and 4, art 8 and 6, music 4 and 8. Which activity has more afternoon than morning visitors, and by how many?
Plan. Draw two equal-width bars per activity using one scale and key; subtract within each pair.
The left chart shows the six heights. Afternoon minus morning gives for chess, for art and for music.
Answer. Music has 4 more afternoon visitors; the other activities have fewer in the afternoon.
Check. The music afternoon bar is twice its morning bar: 8 compared with 4, giving difference 4 rather than 8.
Continue this lesson.
You’re previewing NovaLearn without an account. Create a free account to read the rest.
Create free account