C10.6; E10.6 - Pie charts and stem-and-leaf diagrams
A pie chart makes each category's share of a total visible; a stem-and-leaf diagram keeps the individual numerical values visible. C10.6 and E10.6 use both displays, including calculating pie-chart angles, recovering frequencies and ordering leaves with a clear key.
Pie-chart angles
How large should a sector be if 12 of 40 pupils choose it? A full pie chart represents all 40 pupils using a full turn of . Equal numbers of pupils must occupy equal angles, so each pupil represents degrees.
Pie-chart sector angle
All categories must be disjoint and together cover the whole total. This proportional rule is not supplied on the formula lists: learn how it follows from one full turn.
Calculate the angles before drawing. Mark a radius, measure each angle at the centre with a protractor, then label the sectors or give a key. Use the same circle radius for all sectors. These are data proportions: the angles need not be factors of 360, unlike the separate Core mensuration restriction on sector length and area calculations.
[DIAGRAM: asset_name: Travel-choice pie chart; asset_slug: travel_pie; caption: Forty pupils are represented by a complete turn of 360 degrees.; description: An exact pie chart has Walk twelve pupils angle one hundred and eight degrees, Bus eighteen pupils angle one hundred and sixty-two degrees, Cycle ten pupils angle ninety degrees. Separate labels give counts and angles with clear leaders. The total forty pupils is stated. Blue sage and clay pale fills distinguish the three sectors.]
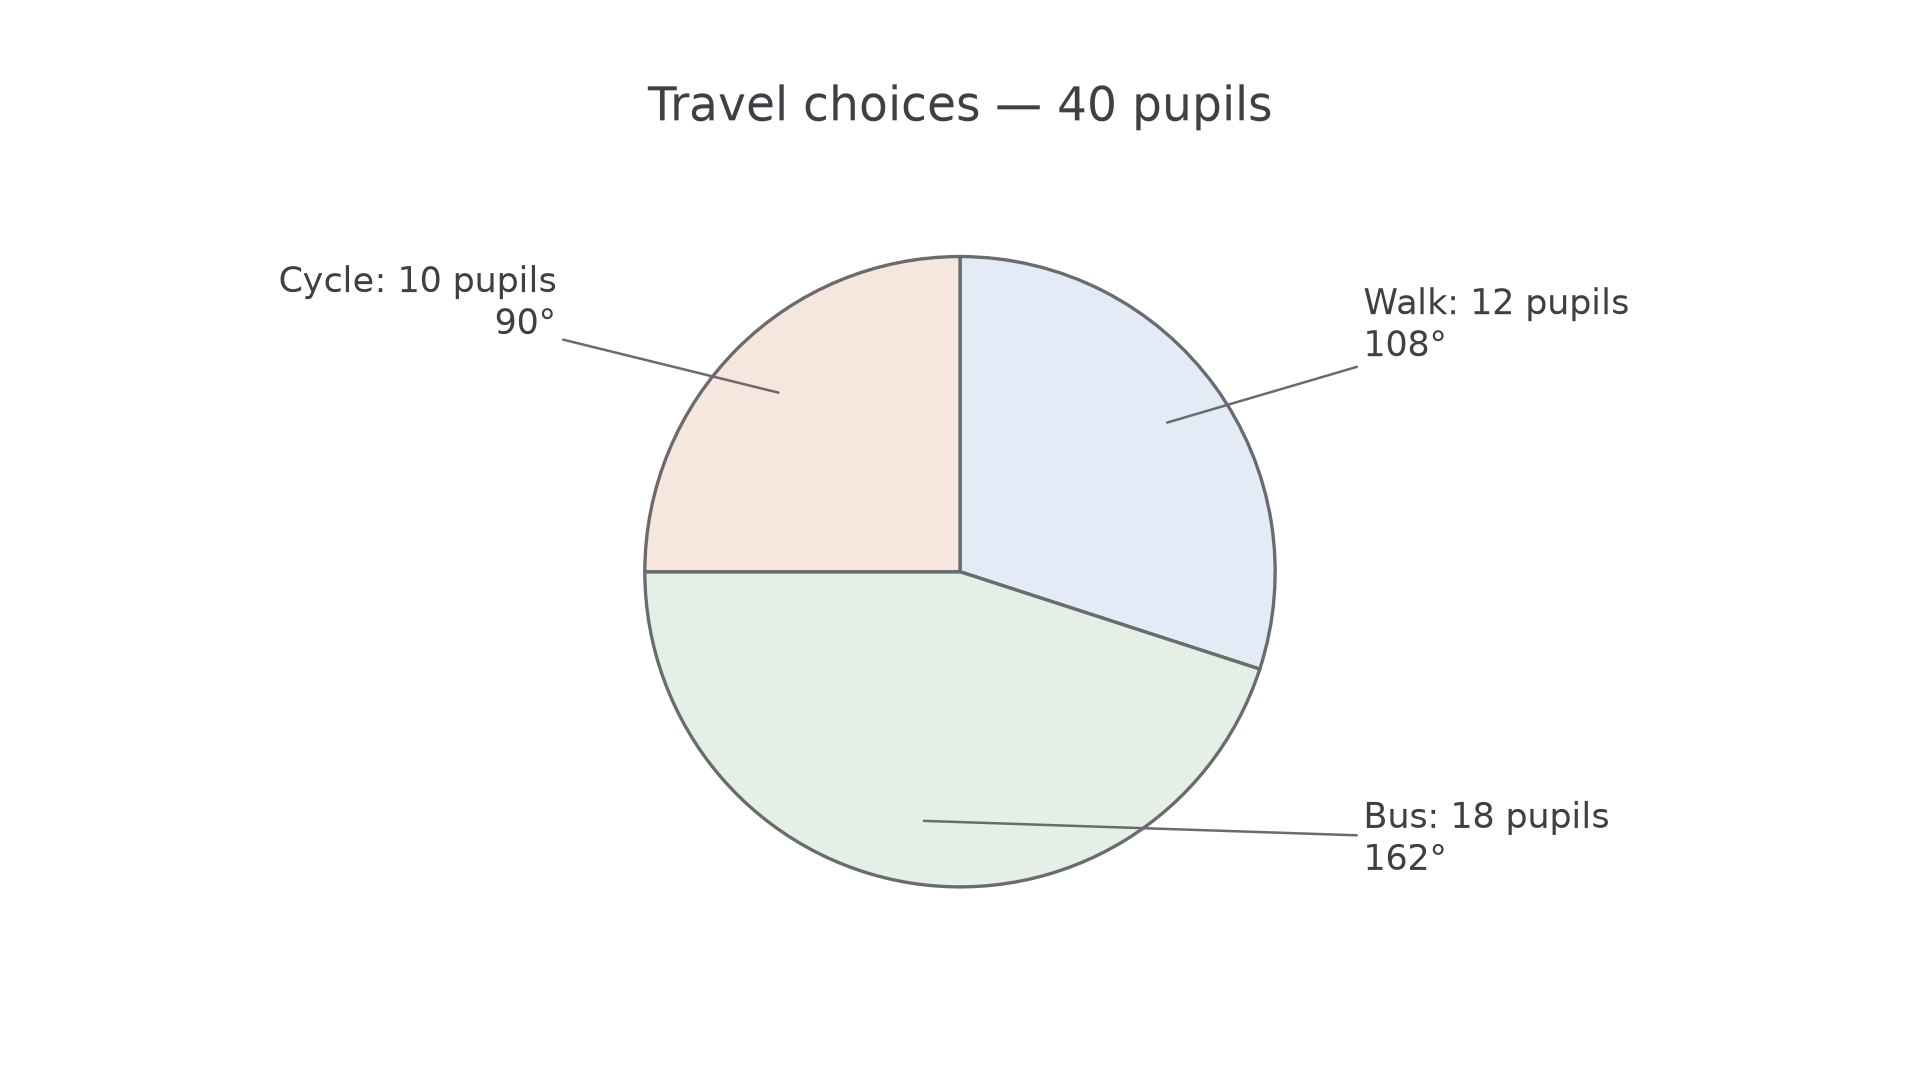
Worked example 1: one category's angle
Question. In a survey of 40 pupils, 12 walk to school. Calculate the angle for walking.
Plan. Find walking's fraction of all pupils and take the same fraction of a full turn.
Answer. .
Check. One pupil represents , so 12 pupils represent . This is a little more than a quarter-turn, as 12 is a little more than one quarter of 40.
Keep the total but complete every category. Checking the angle sum catches a missing or duplicated group.
Worked example 2: a complete chart
Question. The same survey records 18 bus users and 10 cyclists, with every pupil in exactly one of the three categories. Calculate all angles and draw the pie chart.
Plan. Multiply each frequency by per pupil, check the full turn, then measure the sectors.
Answer. Walk , bus , cycle ; the completed chart is shown above.
Check. . Also , so both counts and angles cover the whole survey once.
An angle of is nearly half a circle, matching 18 of 40. A sector angle is measured at the centre, not at the circumference.
Watch out
Do not multiply the frequency alone by 360. It is the category's fraction of the total that becomes a fraction of a turn.
Use a fresh total and category frequency.
Interpreting pie charts
To recover a frequency, reverse the angle calculation. The fraction of the full turn is the fraction of the total count. A pie chart alone supplies proportions; a total count, or one category's count, is needed to recover absolute frequencies.
Frequency from a pie-chart angle
The angle and total must refer to the same chart. This reversal of proportionality is not supplied on the formula lists.
A larger sector means a greater frequency within the same chart. Between charts with different totals, a smaller sector can still represent more people.
Worked example 3: the total is known
Question. A pie chart represents 72 library loans. The history sector has angle . Find the number of history loans.
Plan. Take of the total 72.
Answer. 25 loans.
Check. Each loan represents degrees, and , the given angle.
In the second example, the total is hidden, but one sector's count supplies the scale. Find degrees per person, or people per degree, before using another sector.
Continue this lesson.
You’re previewing NovaLearn without an account. Create a free account to read the rest.
Create free account