C9.1; E9.1 - Probability and complements
A bag contains red, blue and green counters. Is “not red” the same as “blue”? C9.1 and E9.1 develop a scale for chance, calculate probabilities from different representations and use complements to include every outcome outside an event.
Probability scale
If every counter is red, choosing a red counter is certain. If no counter is red, it is impossible. Between these extremes, probability measures how likely an event is.
Outcome, event and probability
An outcome is one possible result of an experiment. An event is a collection of outcomes described by a condition. The probability of an event is a number from 0 to 1: 0 means impossible and 1 means certain.
On a fair six-sided die, “roll 4” is one outcome. “Roll an even number” is an event containing 2, 4 and 6. Half the equally likely outcomes are even, so its probability is .
[DIAGRAM: asset_name: Probability scale; asset_slug: probability_scale; caption: Zero is impossible, one half is an even chance and one is certain.; description: A horizontal scale from zero to one, with ticks at zero, one quarter, one half, three quarters and one. Labels below show impossible at zero, unlikely below one half, even chance at one half, likely above one half and certain at one.]
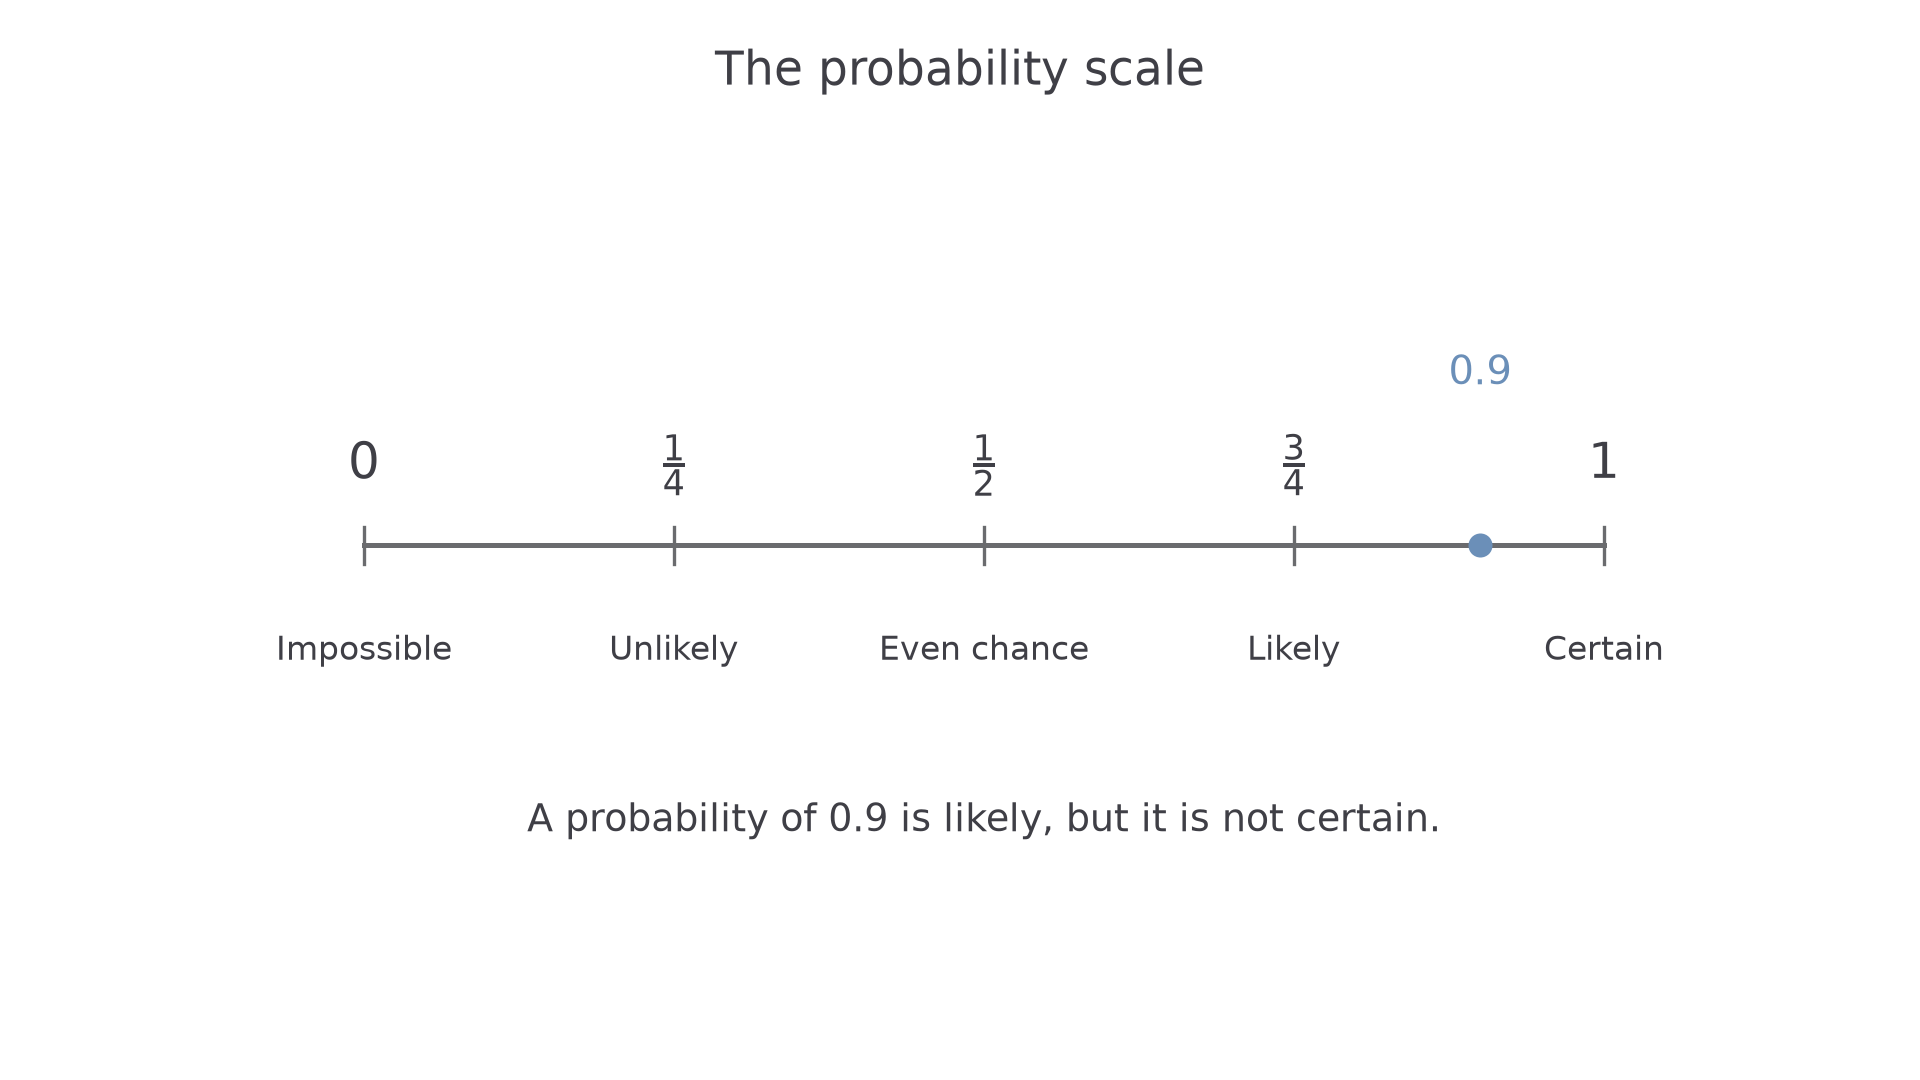
The equivalent forms all mean an even chance. A probability below is less likely than not; a probability above is more likely than not. “Unlikely” still allows the event to happen.
For a bag with 9 red counters and 1 blue counter, choosing red has probability . It is likely, but not certain: the blue counter remains possible. Neither nor can be a probability.
Key idea
The scale describes chance, not a promise about one attempt. A probability of does not guarantee success on the next attempt.
Read the boundary values carefully.
Single events
Counting gives a probability when the individual objects or outcomes are equally likely. First identify everything that could be selected, then count the outcomes satisfying the event.
Equally likely outcomes
Use this counting rule only when the counted outcomes are equally likely. The total must be positive.
Not in the supplied formula list: learn it.
“At random” in a selection of counters means each individual counter has the same chance. Colours need not have the same chance: five red counters provide five favourable objects, not just one colour name.
Worked example 1: a number list
Question. Six identical cards are labelled . One is chosen at random. Find the probability that its label is greater than 4.
Plan. Count the labels satisfying the condition and divide by all six cards.
Answer. .
Check. The other four cards have probability ; together the two groups account for .
A table can collect repeated objects. Add the frequencies, rather than counting the number of table headings.
Worked example 2: counts in a table
Question. A box contains the counters shown. One counter is chosen at random. Find the probability that it is blue, as a fraction, decimal and percentage.
| Colour | Red | Blue | Green |
|---|---|---|---|
| Number of counters | 7 | 5 | 8 |
Plan. Use the five blue counters over the total number of counters, then convert equivalent forms.
Answer. , , or .
Check. Four groups of five make 20. Blue is one of those four equal-sized groups, even though the box has three colour names.
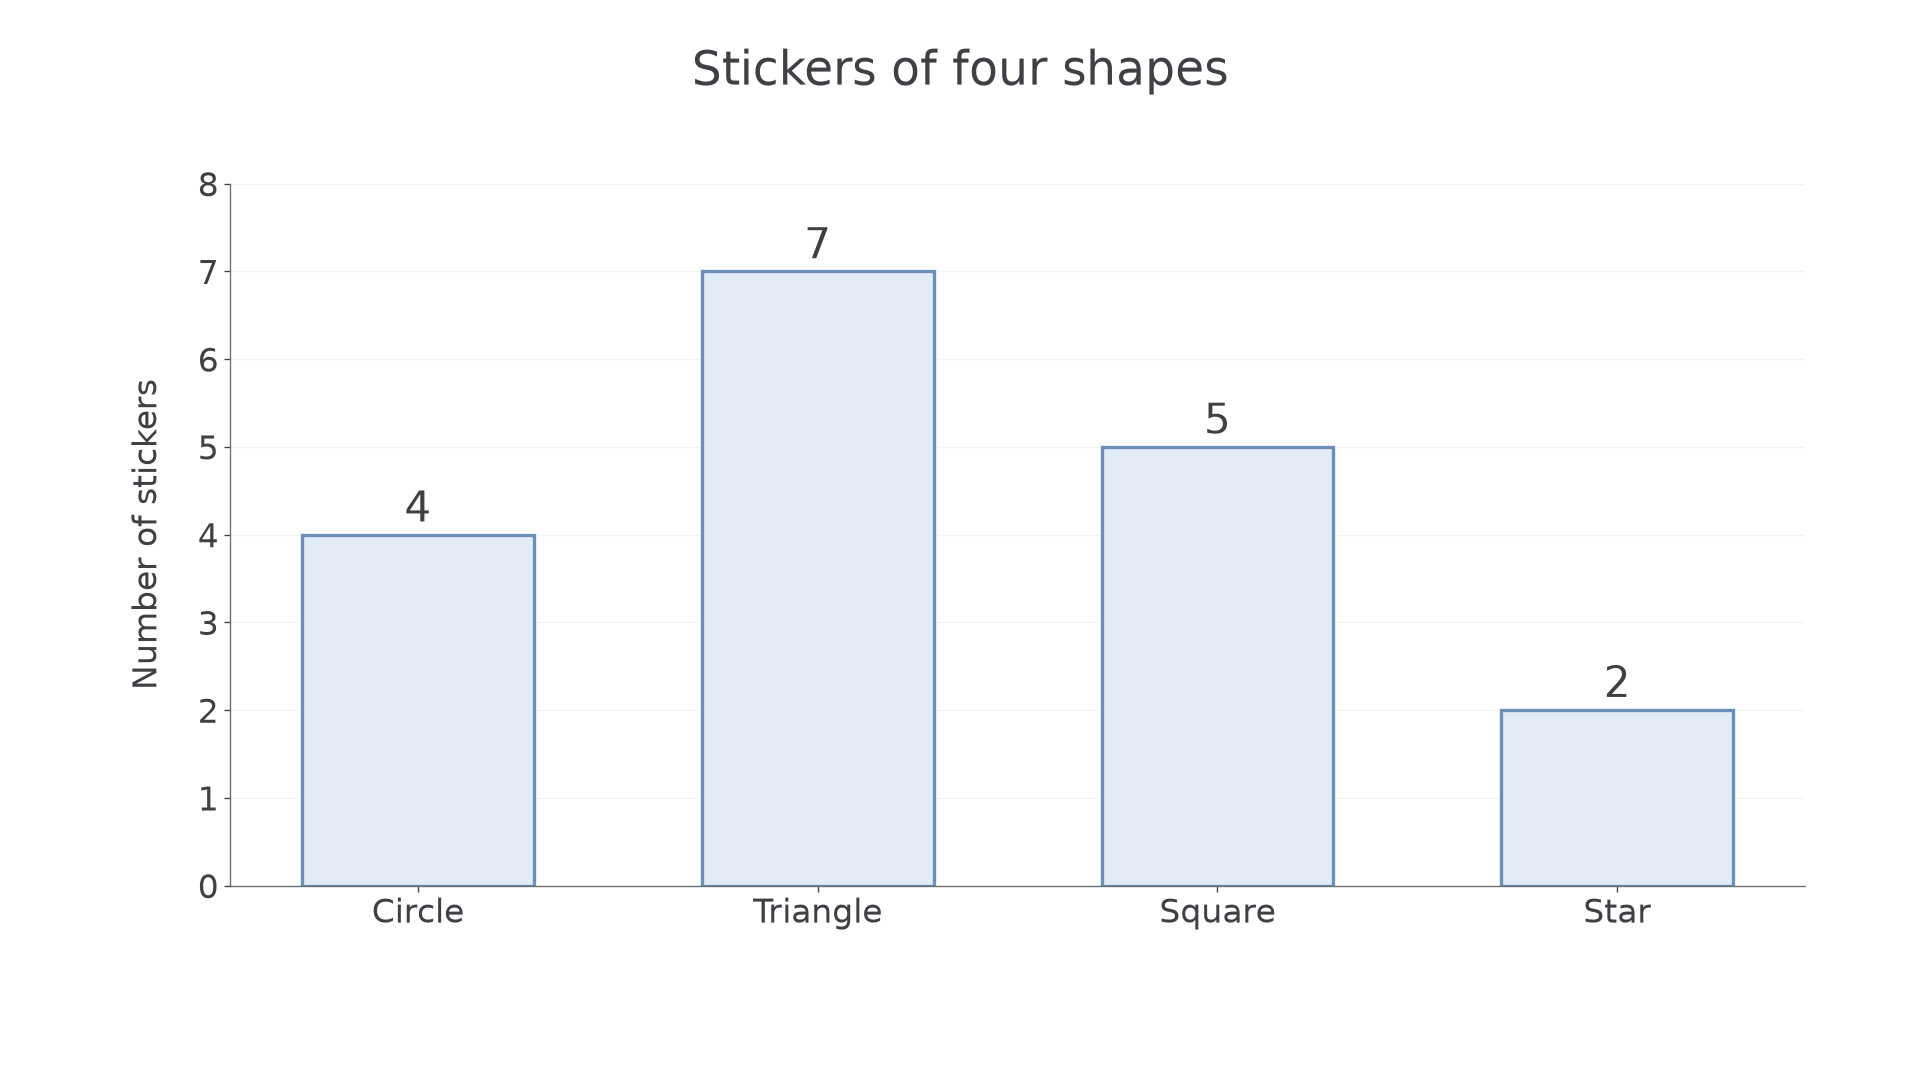
A graph displays the same kind of counts. Read the height against the labelled scale; a bar's colour or width does not give its frequency.
[DIAGRAM: asset_name: Stickers of four shapes; asset_slug: sticker_counts; caption: The bar heights count 18 stickers altogether.; description: A bar chart has horizontal categories circle, triangle, square and star and a vertical number-of-stickers scale from zero to eight in unit steps. The four bar heights are four, seven, five and two. Each height is also labelled.]
Worked example 3: read a graph
Question. The graph shows 4 circle, 7 triangle, 5 square and 2 star stickers. One of these 18 stickers is chosen at random. Find the probability that it is a triangle.
Plan. Read the triangle frequency and compare it with the total of all bar heights.
Answer. .
Check. The 11 non-triangle stickers give . The two fractions total 1, and , as 7 is less than half of 18.
Continue this lesson.
You’re previewing NovaLearn without an account. Create a free account to read the rest.
Create free account