E10.7 - Linear regression on a calculator (Extended)
Two sensible hand-drawn best-fit lines can give slightly different predictions. How can a calculator use every paired observation to produce one specified line? E10.7 introduces permitted linear regression on a graphic display calculator, then interprets its equation and predictions in context.
Paired data
Regression begins with paired lists, not a frequency table. Each row contains one observation's horizontal value and its matching vertical value. Decide which quantity the task wants to predict before selecting the lists.
Linear regression
Linear regression fits an equation of the form to paired observations using the calculator's specified fitting procedure. For a regression giving in terms of , select as the input list and as the response list. The input values must not all be equal.
Clear old entries, enter equal-length lists and plot the pairs to check the data. Select the permitted linear regression feature. A model labelled uses the letters differently from : always read the displayed form. No correlation coefficient is required.
Worked example 1: matching rows
Question. Prepare a GDC to predict score from practice time .
| Time (hours) | 1 | 2 | 3 | 4 | 5 |
|---|---|---|---|---|---|
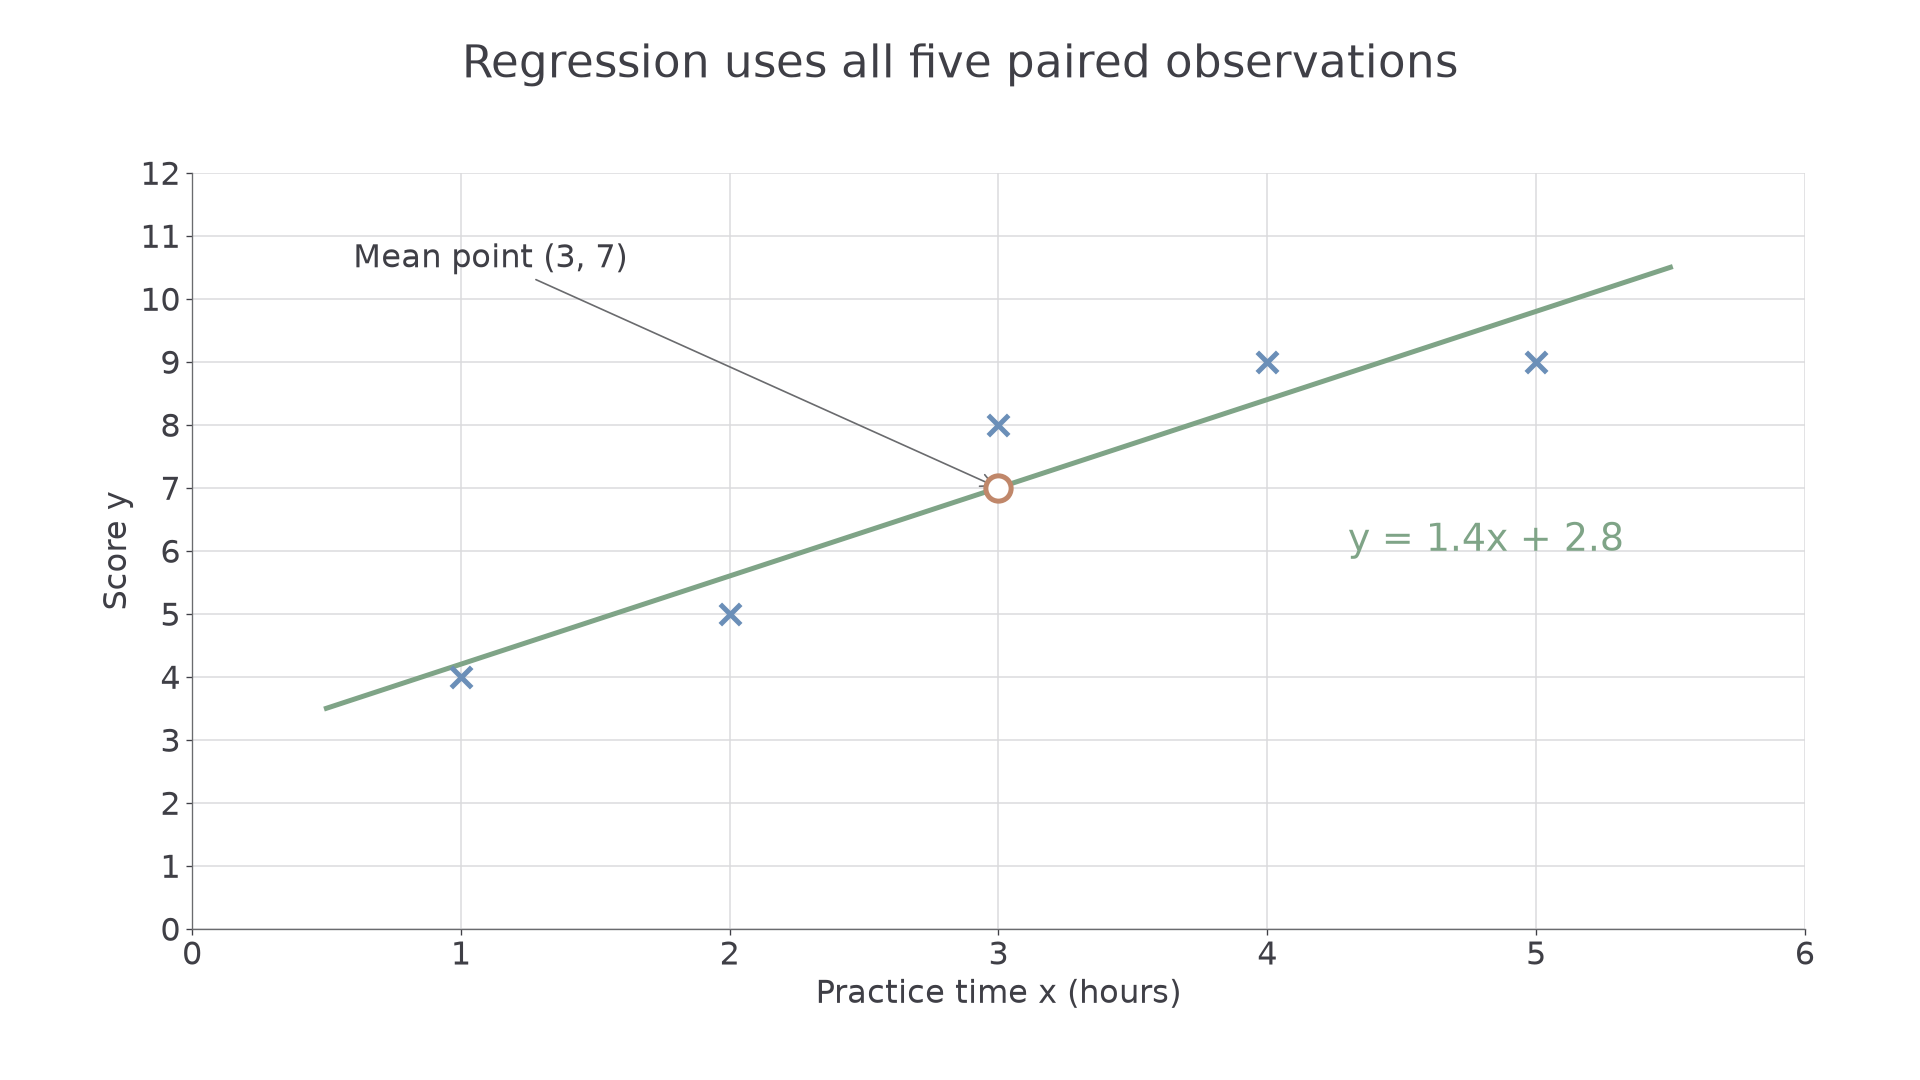
| Score | 4 | 5 | 8 | 9 | 9 |
Plan. Enter times as the input list and matching scores as the response list, then select linear regression for against .
The five rows are . Leave the pair frequency at 1: each row describes one observation.
Answer. Input list ; response list ; linear model predicting from .
Check. There are five complete pairs. The point in the scatter plot checks the middle row; two different times correctly share score 9.
The order of observations can change without changing the regression. Their pairing must survive that change.
Worked example 2: unsorted observations
Question. Journey distance and fare are recorded in this order: . Prepare the lists for predicting fare from distance.
Plan. Enter each supplied pair on the same row; sorting is unnecessary.
| Input list | 8 | 2 | 10 | 4 | 6 |
|---|---|---|---|---|---|
| Response list | 15 | 5 | 17 | 8 | 10 |
Answer. Select those lists, each pair with frequency 1, for linear regression of fare on distance.
Check. The largest distance still pairs with fare 17. If sorting by distance, move whole pairs together; sorting each list independently could invent different journeys.
Swapping the input and response lists asks for a different regression. It generally does not give an equation equivalent to rearranging the first one.
Regression equation
Run the selected linear regression and write its output as a complete equation. Keep full calculator coefficients for later substitutions, rounding the displayed final equation as requested. Using two chosen observations to calculate a gradient gives a line through those observations, rather than the requested regression using all the data.
[DIAGRAM: asset_name: Regression uses the full cloud; asset_slug: regression_full_cloud; caption: The regression line uses all five observations and passes through their mean point.; description: Practice times 1,2,3,4,5 and scores 4,5,8,9,9 are marked as crosses. The linear regression y=1.4x+2.8 and the mean point (3,7) are shown. The fitted values need not equal any observed score.]
Continue this lesson.
You’re previewing NovaLearn without an account. Create a free account to read the rest.
Create free account