C3.2; E3.2 - Zeros, vertices and intersections
A graph can reveal where a function is zero, where it turns and where it meets another graph. Learn to locate these features with a graphic display calculator, then check that its coordinates answer the question. These are the shared C3.2 and E3.2 graph skills.
Zeros
Where does meet the horizontal axis, and how low does its curve go? A well-chosen window makes these features visible; the calculator's graph tools locate them more accurately than a cursor read-off.
Zero of a function
A zero is an input for which the output is zero: . A zero gives an intercept on the -axis. The zero is a number; the intercept is a coordinate pair.
Enter the complete function with brackets where needed. Set a window showing the relevant crossings. Select the zero/root feature from the graph menu and isolate the chosen crossing: calculators may ask for lower and upper bounds, or a nearby cursor position. Repeat at every crossing. A table near each answer provides a separate check. A curve may also touch the axis at a zero without crossing it.
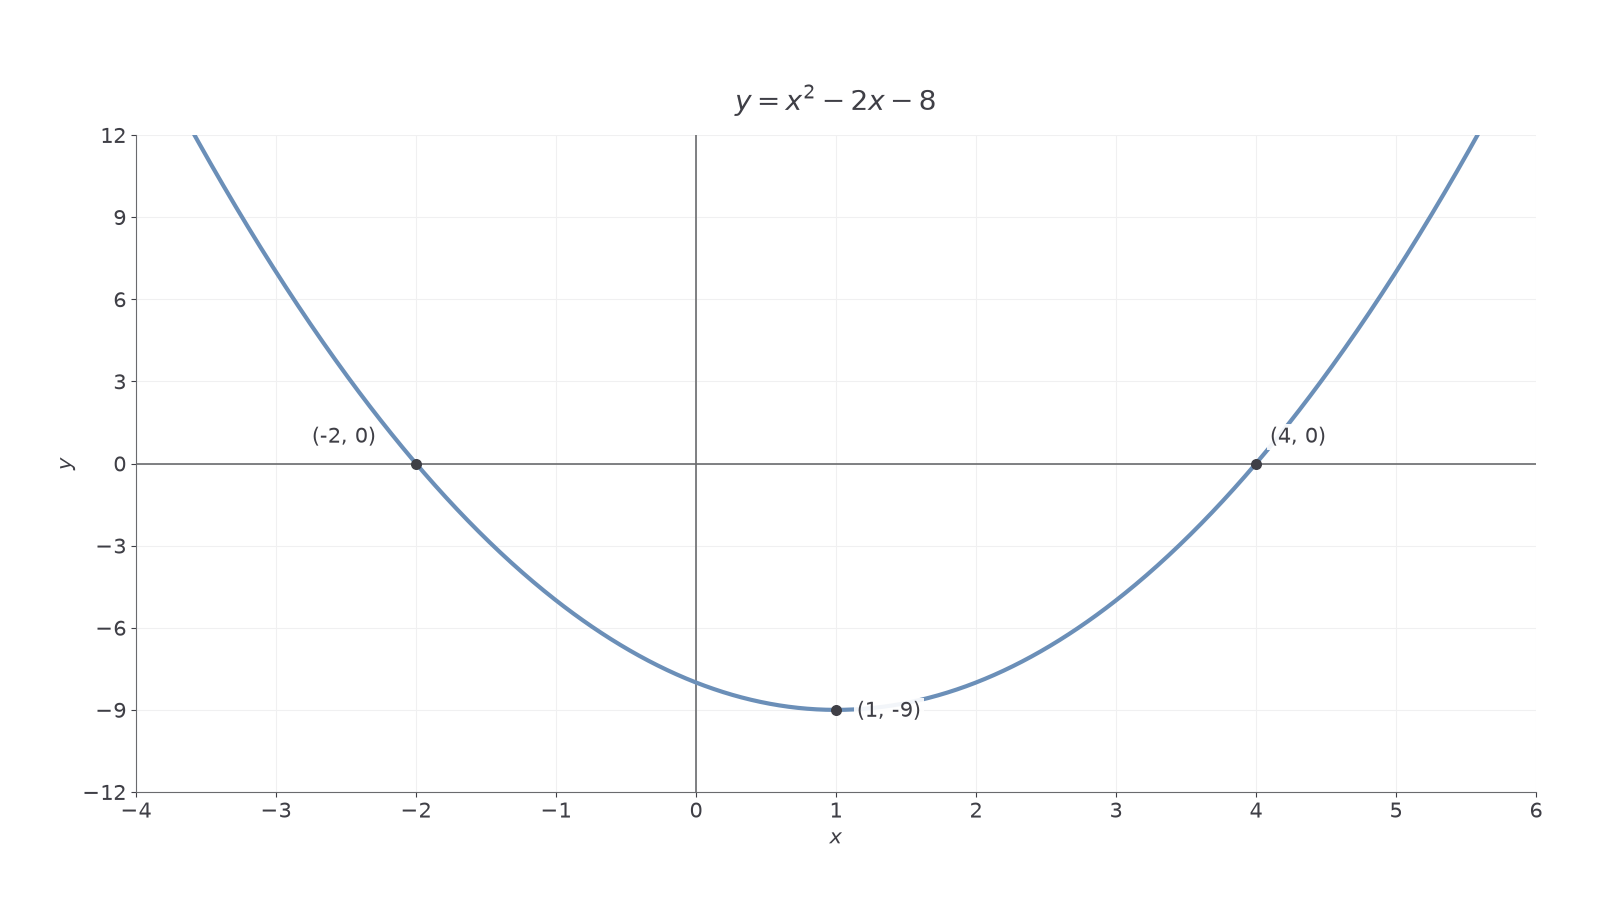
[DIAGRAM: asset_name: Quadratic zeros and minimum; asset_slug: quadratic_features; caption: The two zeros are inputs; the vertex has two coordinates.; description: Exact graph of y equals x squared minus two x minus eight over minus four to six. Its intercepts are labelled minus two zero and four zero, and its minimum is labelled one minus nine. Axes have numbered scales.]
Worked example 1: two zeros
Question. Use a GDC to find the zeros of .
Plan. Show both crossings, then isolate each with the zero feature.
- Enter . Use , .
- Locate the left crossing between and : the zero feature returns .
- Repeat between 3 and 5: it returns .
Answer. The zeros are and 4.
Check. and . Both visible crossings have been located.
The next curve has no integer zeros. Keep the calculator's full values until the final rounding.
Worked example 2: approximate zeros
Question. Find the zeros of , correct to 3 significant figures.
Plan. Locate both crossings, keeping extra digits for checking.
- Enter , using , .
- Isolate the crossings in and .
- The graph tool gives approximately and .
Answer. or , to 3 significant figures.
Check. Substitution of the unrounded values gives outputs close to zero. The rounded values each give , a small rounding residual rather than an exact zero.
The requested accuracy applies to the answer, not the intermediate calculator value.
Watch out
A zero is not the -intercept. The -intercept uses ; finding a zero means finding an input that makes .
Use the graph feature for your next read-off.
Extrema and vertices
A curve's turning point has both an input and an output: its horizontal position and its height.
Local maximum and local minimum
At a local maximum, the function's value is at least as high as nearby values. At a local minimum, it is at least as low as nearby values. A quadratic's turning point is its vertex: a minimum for an upward-opening curve and a maximum for a downward-opening curve.
Use the graph's minimum or maximum feature. Isolate the turning point with bounds or a cursor neighbourhood as your calculator requires. Read both coordinates, and compare outputs on each side. The top or bottom edge of the screen is a window boundary, not automatically a turning point. An unfamiliar curve can have more than one local extremum, so inspect the whole requested interval.
Continue this lesson.
You’re previewing NovaLearn without an account. Create a free account to read the rest.
Create free account