C4.1; E4.1 - Cartesian coordinates
Does name the same place as ? Coordinates give a precise address on a flat grid, but the order and scale both matter. C4.1 and E4.1 develop reading and placing points in all four quadrants, including grids with fractional and decimal scales.
Two axes
Two number lines cross at right angles to locate a point. The horizontal line is the -axis, the vertical line is the -axis, and their crossing is the origin, . Values increase to the right and upwards.
Cartesian coordinates
The ordered pair gives a point's horizontal position first and vertical position second. From the origin, positive means right and negative means left; positive means up and negative means down.
Start with the horizontal coordinate even when it is negative. You can imagine walking along the -axis, then moving vertically to the point. These movements locate the point; they do not prescribe a journey that an object must take.
[DIAGRAM: asset_name: Ordered pairs in four quadrants; asset_slug: coordinates_four_quadrants; caption: Changing the order changes the point: A is at minus 3, 2 and B is at 2, minus 3.; description: An accurately scaled Cartesian grid from minus four to four on both axes shows A at minus three comma two, B at two comma minus three, C at three comma two and D at minus three comma minus two. The four quadrants are labelled I positive positive, II negative positive, III negative negative and IV positive negative. Dashed projection lines from A and B show their two coordinate readings.]
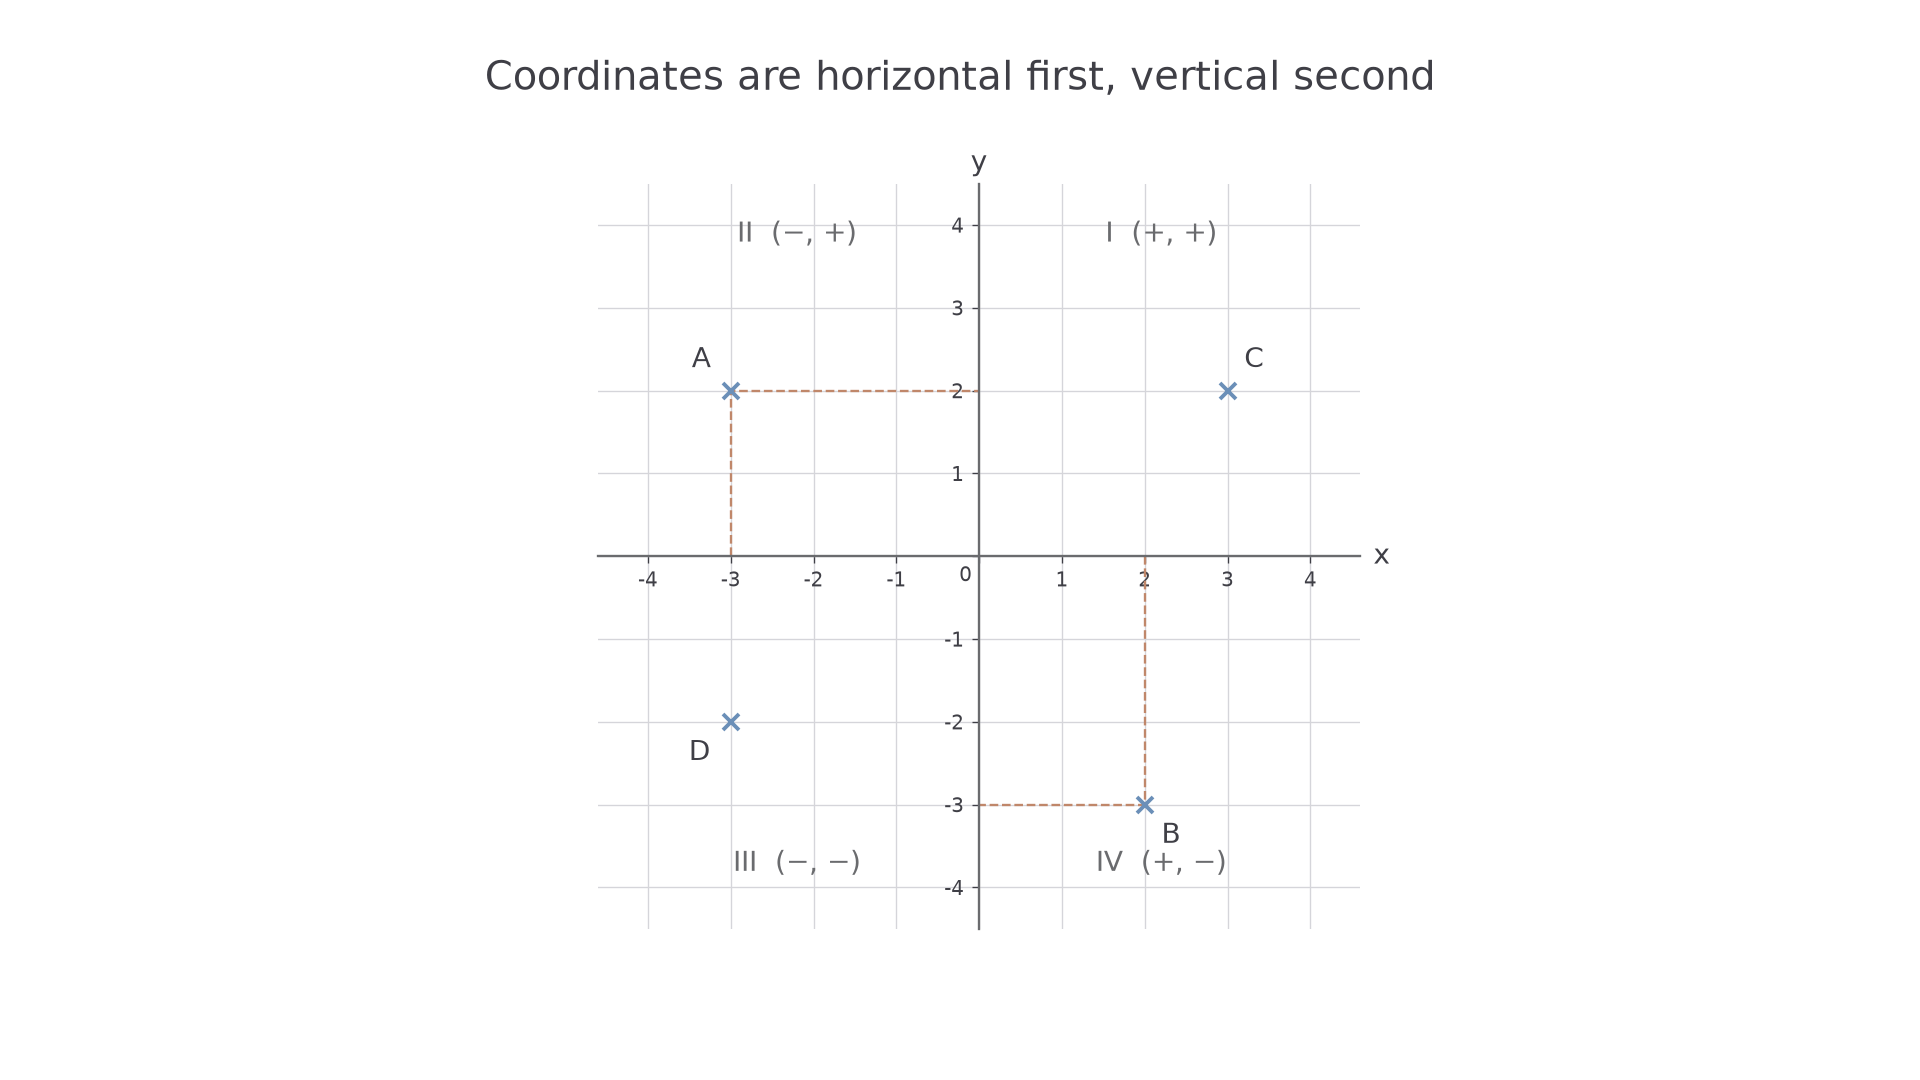
Worked example 1: interpreting an ordered pair
Question. Describe the position of relative to the origin.
Plan. Read the first coordinate horizontally, then the second vertically.
Answer. is 3 units left and 2 units above the origin.
Check. A point left of the -axis has negative ; a point above the -axis has positive . Both signs match .
Now swap the same two numbers. The horizontal instruction changes as well as the vertical one.
Worked example 2: reversing the order
Question. Describe the position of relative to the origin.
Plan. Apply the same horizontal-first convention to the new order.
Answer. is 2 units right and 3 units below the origin, so it is a different point from .
Check. Its right-and-down position has signs , matching .
The axes divide the plane into four quadrants, numbered anticlockwise from the upper-right region: I has signs , II , III , and IV . A point on an axis belongs to no quadrant. For , zero horizontal movement puts it on the -axis; for , zero vertical movement puts it on the -axis.
Watch out
Coordinates are an ordered pair, not an unordered list. Write , with brackets and a comma; reversing the entries usually gives another point. Zero is a coordinate value, not an instruction to omit an entry.
Use a zero coordinate to check the axis rule.
Plotting points
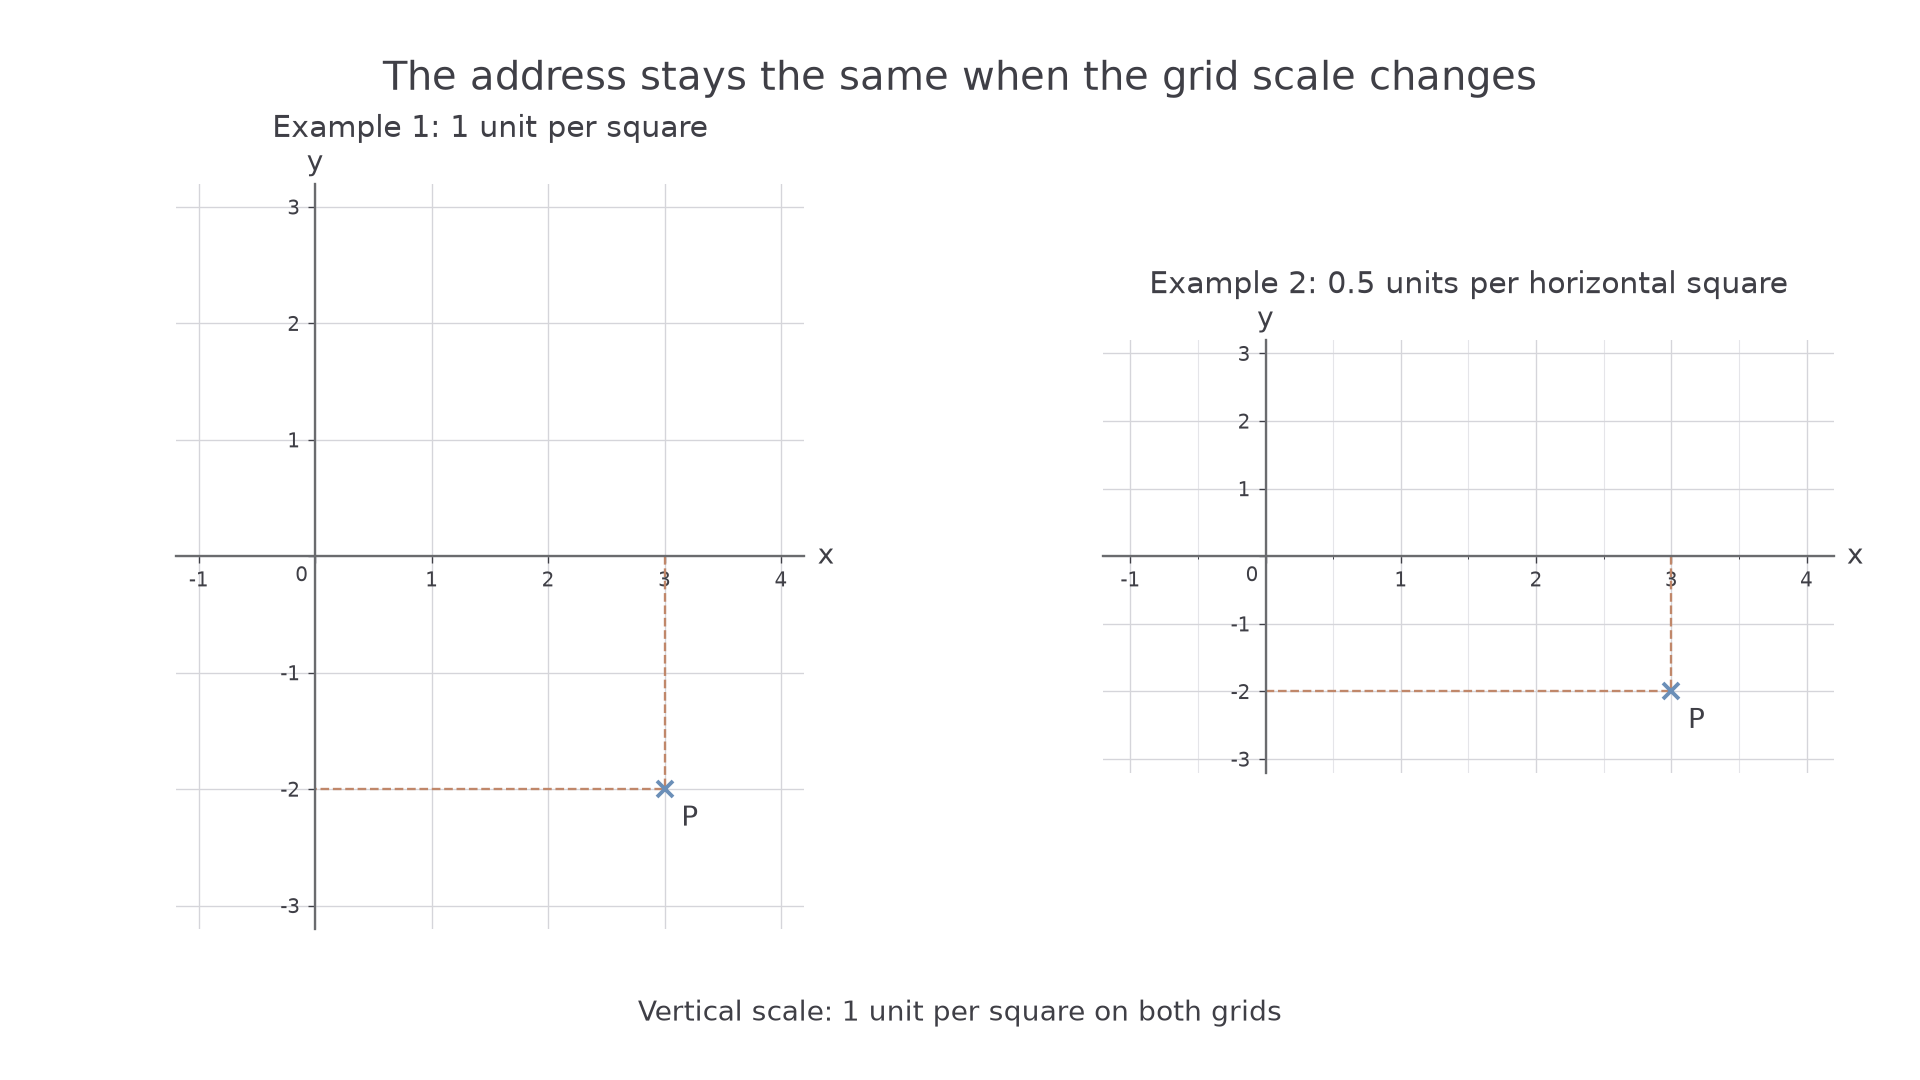
Read the scale on each axis before counting squares. If two adjacent labelled values are 0 and 2 with four equal small squares between them, each small square represents units. The two axes can have different scales.
Plotting a point
To plot , find the required -position and -position using the axes' scales, then mark their intersection with a small clear cross. Put the point's letter nearby, without covering the cross.
Choose axes that include all the required coordinates, label them and , and keep each axis's scale uniform. A plot is accurate to scale; a sketch merely communicates important features. Aim for the exact intersection; graph readings and plots are expected within half the smallest square. Separate points stay separate unless a question asks you to join them. When a straight line is required, draw it with a ruler.
[DIAGRAM: asset_name: One point on two scales; asset_slug: plotting_point_scales; caption: The point is three units right and two units down in both grids, but the number of squares changes.; description: Two accurate grids show P at three comma minus two. On the left one small square is one unit on each axis, so P is three squares right and two down. On the right one small square is half a unit horizontally and one unit vertically, so P is six squares right and two down. Both axes have clearly labelled numeric scales and the point cross and letter are separated.]
Continue this lesson.
You’re previewing NovaLearn without an account. Create a free account to read the rest.
Create free account