E9.7 - Histograms and frequency density
The tallest bar in a histogram need not contain the most observations. You will connect frequency to bar area, calculate frequency density, and draw or interpret histograms whose class widths differ.
Frequency represented by area
How can a short, wide histogram bar represent more observations than a tall, narrow one? A histogram gives the count through area, so width matters as well as height.
A histogram represents grouped numerical data using bars across their class intervals on a continuous measurement scale. Bars for adjoining intervals touch; a genuinely empty class has zero area. The vertical axis is labelled Frequency density. It tells you how many observations are represented per unit of horizontal class width.
Imagine twenty observations spread over a class five units wide. A density of four observations per unit produces area . Spread the same twenty over a class ten units wide and the height must halve to two: . These are representative densities, not a claim that the actual observations are evenly spaced inside the class.
Worked example 1: equal counts with different heights
Question. In the left histogram below, the class has density four and has density two. Find their frequencies.
Plan. Multiply each numerical class width by its density to obtain frequency.
Answer. Both classes contain twenty observations, although the first bar is twice as tall.
Check. The second rectangle is twice as wide and half as tall as the first, so their areas must be equal. That independently explains the equal frequencies.
Keep the heights but extend only the second class to twenty. The extra width now represents extra observations.
Worked example 2: a shorter bar with a larger frequency
Question. The right histogram has at density four and at density two. Which class has more observations?
Plan. Recalculate the changed class width before comparing areas.
Answer. The second class contains more observations, thirty rather than twenty, despite its lower bar height.
Check. Extending the second bar from fifteen to twenty adds a strip five units wide and two high, representing ten more observations. Its previous twenty therefore become thirty.
[DIAGRAM: asset_name: Area rather than height represents frequency; asset_slug: histogram_area; caption: Equal areas represent equal counts; a wider short bar can represent a greater count.; description: Two histogram panels have horizontal Measurement x and vertical Frequency density, with all numerical scales visible. The left has adjoining bars zero to five height four and five to fifteen height two, each labelled frequency twenty. The right keeps zero to five height four labelled frequency twenty and extends the second bar from five to twenty at height two labelled frequency thirty. Pale blue and pale green fills distinguish the two intervals consistently.]
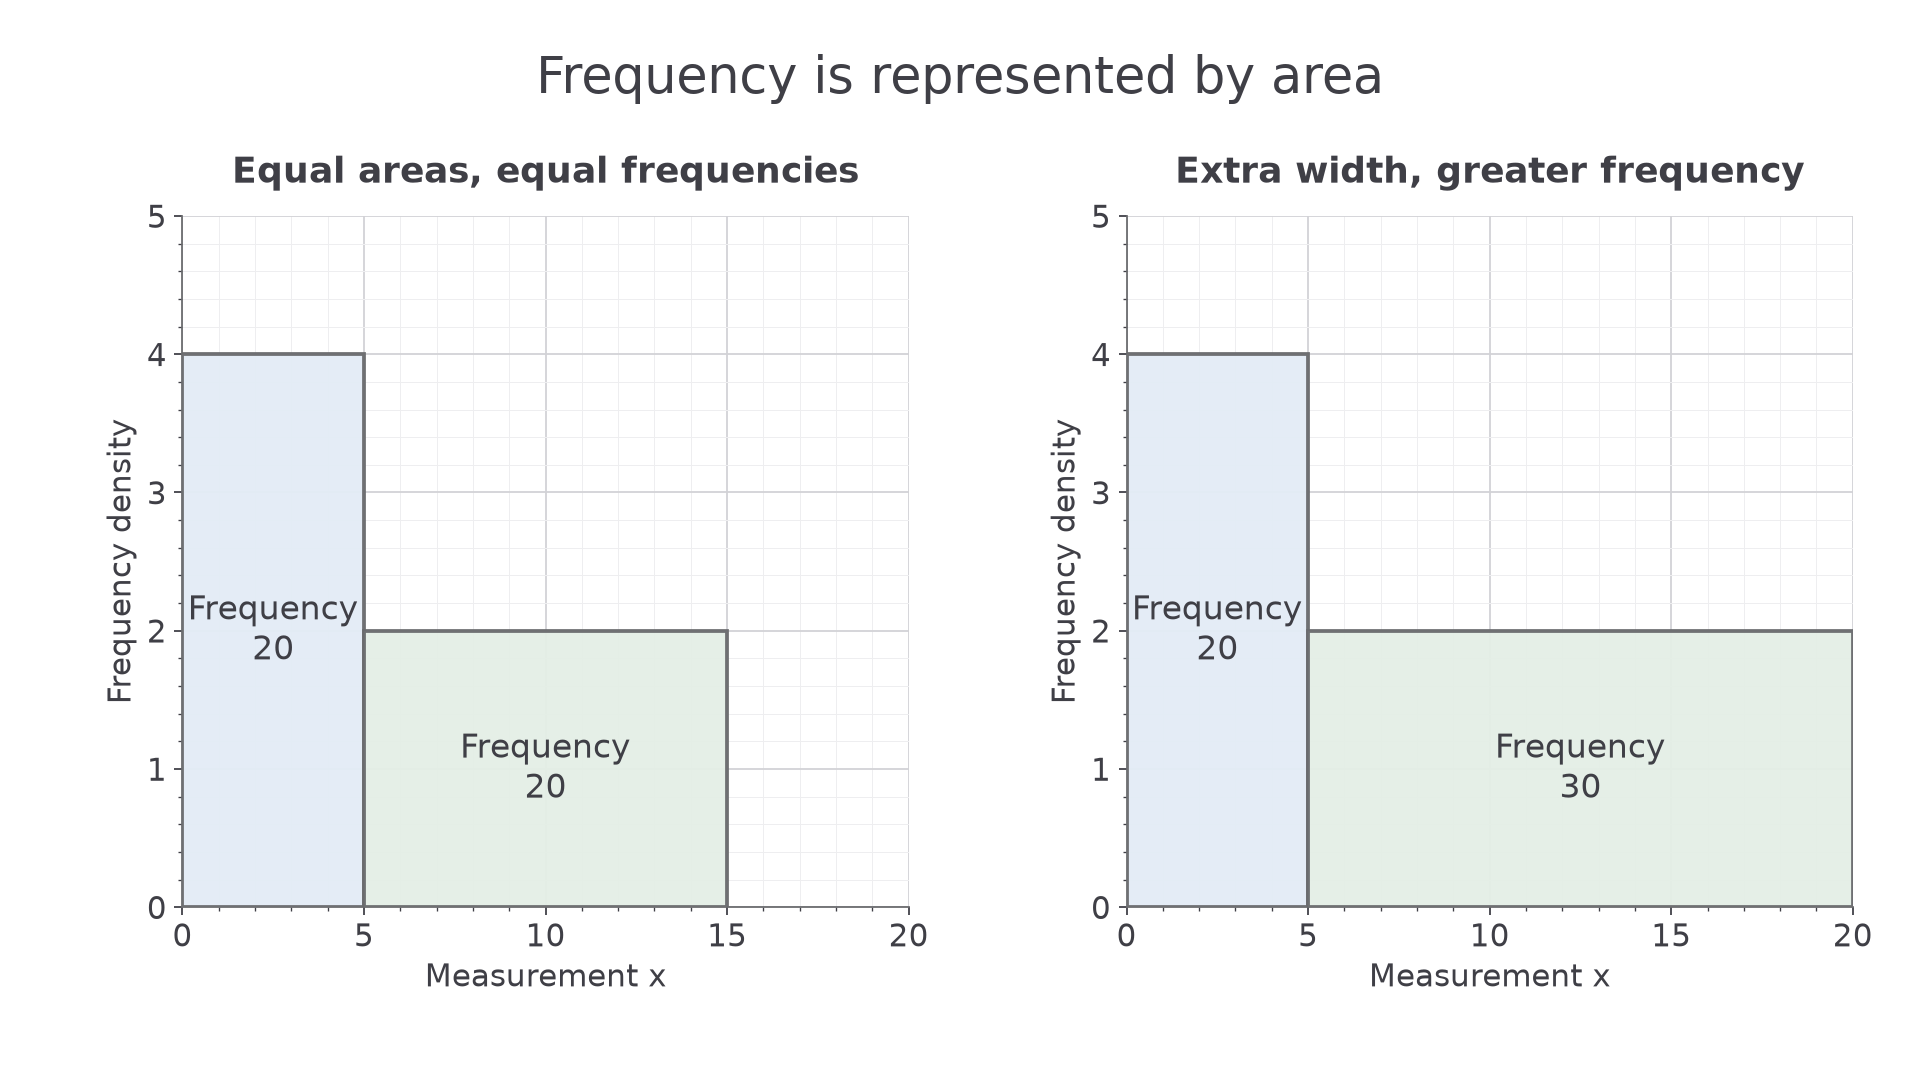
The rectangles therefore preserve counts while allowing a continuous horizontal scale. Changing a class width without changing its height changes its represented frequency.
Watch out
The heights four and two are densities, not frequencies. Compare to compare frequencies when class widths differ. For equal widths, the greater height does correspond to the greater frequency.
Use area to compare a fresh pair of bars.
Calculating frequency density
To choose a histogram's heights, divide each class frequency by its width. A frequency of twenty over five units needs four observations per unit; the same twenty over ten units needs only two.
Frequency density
For a class of positive width,
A zero-frequency class has zero density. A class width of zero cannot be used in this division. These formulas are not given in the List of formulas: learn them.
Use differences between horizontal boundaries for widths. A class from fifteen to thirty has width fifteen, not thirty. Density may be a decimal even when the frequency is a whole number.
Worked example 3: converting a table into heights
Question. Calculate the frequency densities for the table.
| Time , minutes | Frequency | Class width | Frequency density |
|---|---|---|---|
Plan. Calculate each boundary difference, then divide its count by that width.
Answer. The required bar heights are two, four and two on a frequency-density axis.
Check. Multiplying back gives , equal to the original total frequency .
Reverse the same relationship when a height is supplied. Frequency and density are different quantities, so keep their headings attached to the values.
Worked example 4: recovering a missing frequency or width
Question. One class has width fifteen and frequency density . Another has frequency twenty and density four. Find the first class's frequency and the second class's width.
Plan. Use frequency equals density times width, rearranging it when width is unknown.
Answer. The first class contains twenty-four observations; the second class is five units wide.
Check. recovers the first density. Four observations per unit over five units gives twenty, confirming the second width.
Continue this lesson.
You’re previewing NovaLearn without an account. Create a free account to read the rest.
Create free account