C9.2; E9.2 - Interpreting and comparing data
A statistical conclusion needs more than a correct calculation. You will draw supported inferences from displays, compare both centre and spread in context, and explain what a sample or a few summary numbers leave uncertain.
Drawing conclusions from tables and diagrams
Does eighteen votes show that a choice is more popular than twelve votes? It depends how many people were asked. Reading a display means connecting its numbers to its headings, key, units and total before drawing a conclusion.
Start with what the display directly records: who or what was observed, the variable, and any stated time period. Then distinguish a count, such as twelve people, from a proportion, such as twelve out of twenty. Counts answer “how many?”; proportions help compare relative popularity when totals differ.
Worked example 1: different sample totals
Question. Two groups choose between cycling and another activity. How many choose cycling in each group, and which group has the larger percentage choosing cycling?
| Group | Cycling | Other | Total responses |
|---|---|---|---|
| A | |||
| B |
[DIAGRAM: asset_name: Counts from two different-sized groups; asset_slug: different_group_counts; caption: More cycling votes need not mean a larger percentage when group totals differ.; description: A complete dual bar chart has horizontal categories Cycling and Other, vertical axis Number of responses marked from zero to twenty-four in steps of two, blue Group A bars twelve and eight and green Group B bars eighteen and twenty-two. A key labels the groups and the title states Group A twenty responses and Group B forty responses. All bars start at zero and categories are separated.]
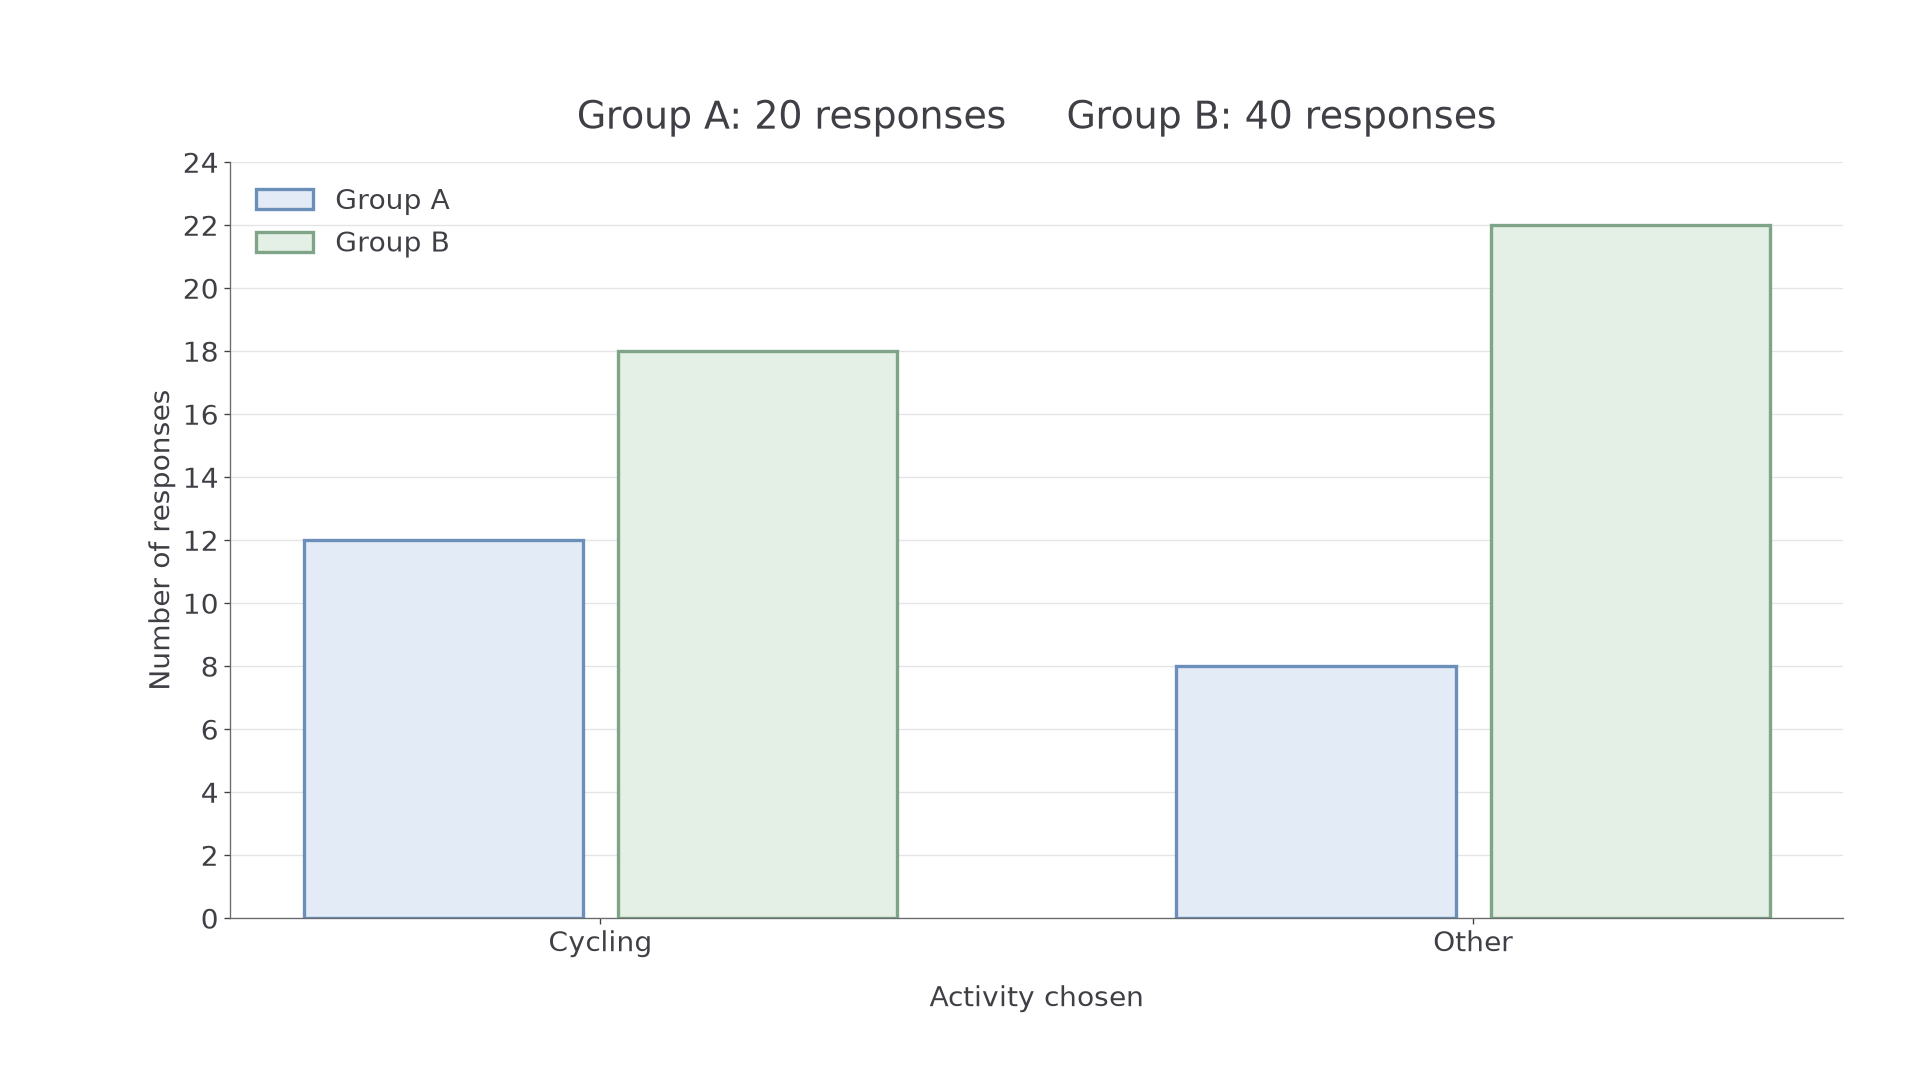
Plan. Read the cycling counts, then divide each by its own group's total.
Answer. A has cycling votes and B has . Cycling has the larger percentage in A: compared with in B.
Check. Twelve is more than half of twenty, whereas eighteen is less than half of forty. This confirms the percentage comparison without relying on the decimal arithmetic.
Keep the cycling counts, but change B's total from forty to thirty. A conclusion about proportions can change even when the displayed counts of interest stay the same.
Worked example 2: the same counts with a different total
Question. A has cycling votes out of . B now has cycling votes out of . Compare the proportions choosing cycling.
Plan. Reduce both fractions before comparing them.
Answer. Both groups have the same cycling proportion, , or , despite B having six more cycling votes.
Check. B's total is times A's total, and its cycling count is also times A's. Equal scaling preserves the proportion.
Watch out
A taller count bar does not by itself prove a larger percentage. Check whether the totals are equal. A chart can show the larger number correctly while a claim about relative popularity is still wrong.
Read both the numerator and the denominator in this new comparison.
Comparing centre and spread
Two data sets can have the same average but different spreads. An average compares a centre; a range compares the distance between extremes. Use both when you want to describe typical performance and consistency, and name the measured quantity and its unit.
A smaller range means less spread between the observed extremes. It is reasonable to describe these observations as more consistent in that sense. The range alone does not reveal how the values are arranged between the extremes, so it cannot describe every aspect of their variation.
Worked example 3: equal averages, different ranges
Question. These are journey times in minutes for two buses on five recorded trips. Compare the mean journey time and the spread.
| Bus A | |||||
|---|---|---|---|---|---|
| Bus B |
Plan. Calculate each mean and each range, then translate the comparison into journey-time language.
Answer. Both have mean journey time ten minutes. A's times have a smaller range, four minutes rather than eight, so these recorded trips are more consistent by this measure.
Check. Both lists are symmetric around ten. B extends four minutes either side of ten, whereas A extends only two minutes either side, confirming both the equal means and the different ranges.
Now increase every B time by two minutes. This changes its centre, while every difference between its times stays the same.
Worked example 4: changing centre without changing spread
Question. A's times remain minutes. B's times become minutes. Compare centre and spread.
Plan. Reuse A's summaries and track the effect of adding two to every B observation.
Answer. A has a shorter mean journey time, ten minutes compared with twelve. A also has the smaller range, four minutes compared with eight, so its recorded times are more consistent by range.
Check. B's new total is , giving . Also : the common increase cancels in the range.
Continue this lesson.
You’re previewing NovaLearn without an account. Create a free account to read the rest.
Create free account