C9.4; E9.4 - Bar charts, pie charts and pictograms
The same data can tell different stories when you change its display. You will draw and read ordinary, dual and stacked bar charts, turn frequencies into pie-chart angles, and use pictogram keys including parts of symbols.
Bar charts with one or two data sets
Can identical-looking pie charts represent different numbers of people? Keep that question in mind while you learn how each display connects a picture to its quantities. A chart is useful only when its scale or key tells you what the shapes represent.
A bar chart uses bar length to show frequency. Category bars have equal widths and gaps between categories. Label both axes, give the frequency axis a uniform scale starting at zero, and use a title that says whose observations are shown. Each equal step up the axis must represent the same increase. Category order can be chosen sensibly; heights, rather than horizontal positions, carry the numbers.
Worked example 1: constructing one data set
Question. Draw a bar chart for West club's chosen activities.
| Activity | Art | Music | Sport |
|---|---|---|---|
| Number of members |
Plan. Put activities on the horizontal axis and choose a frequency scale reaching at least twelve.
Use intervals of members, starting at . Draw equal-width bars with gaps, ending at .
Answer. The completed chart is shown below.
[DIAGRAM: asset_name: West club activity choices; asset_slug: west_bar_chart; caption: The frequency scale rises by two members at each labelled step.; description: A single bar chart titled West club activity choices has separated equal-width bars Art eight, Music twelve and Sport ten. The horizontal axis is Activity and the vertical axis is Number of members, marked from zero to fourteen in steps of two.]
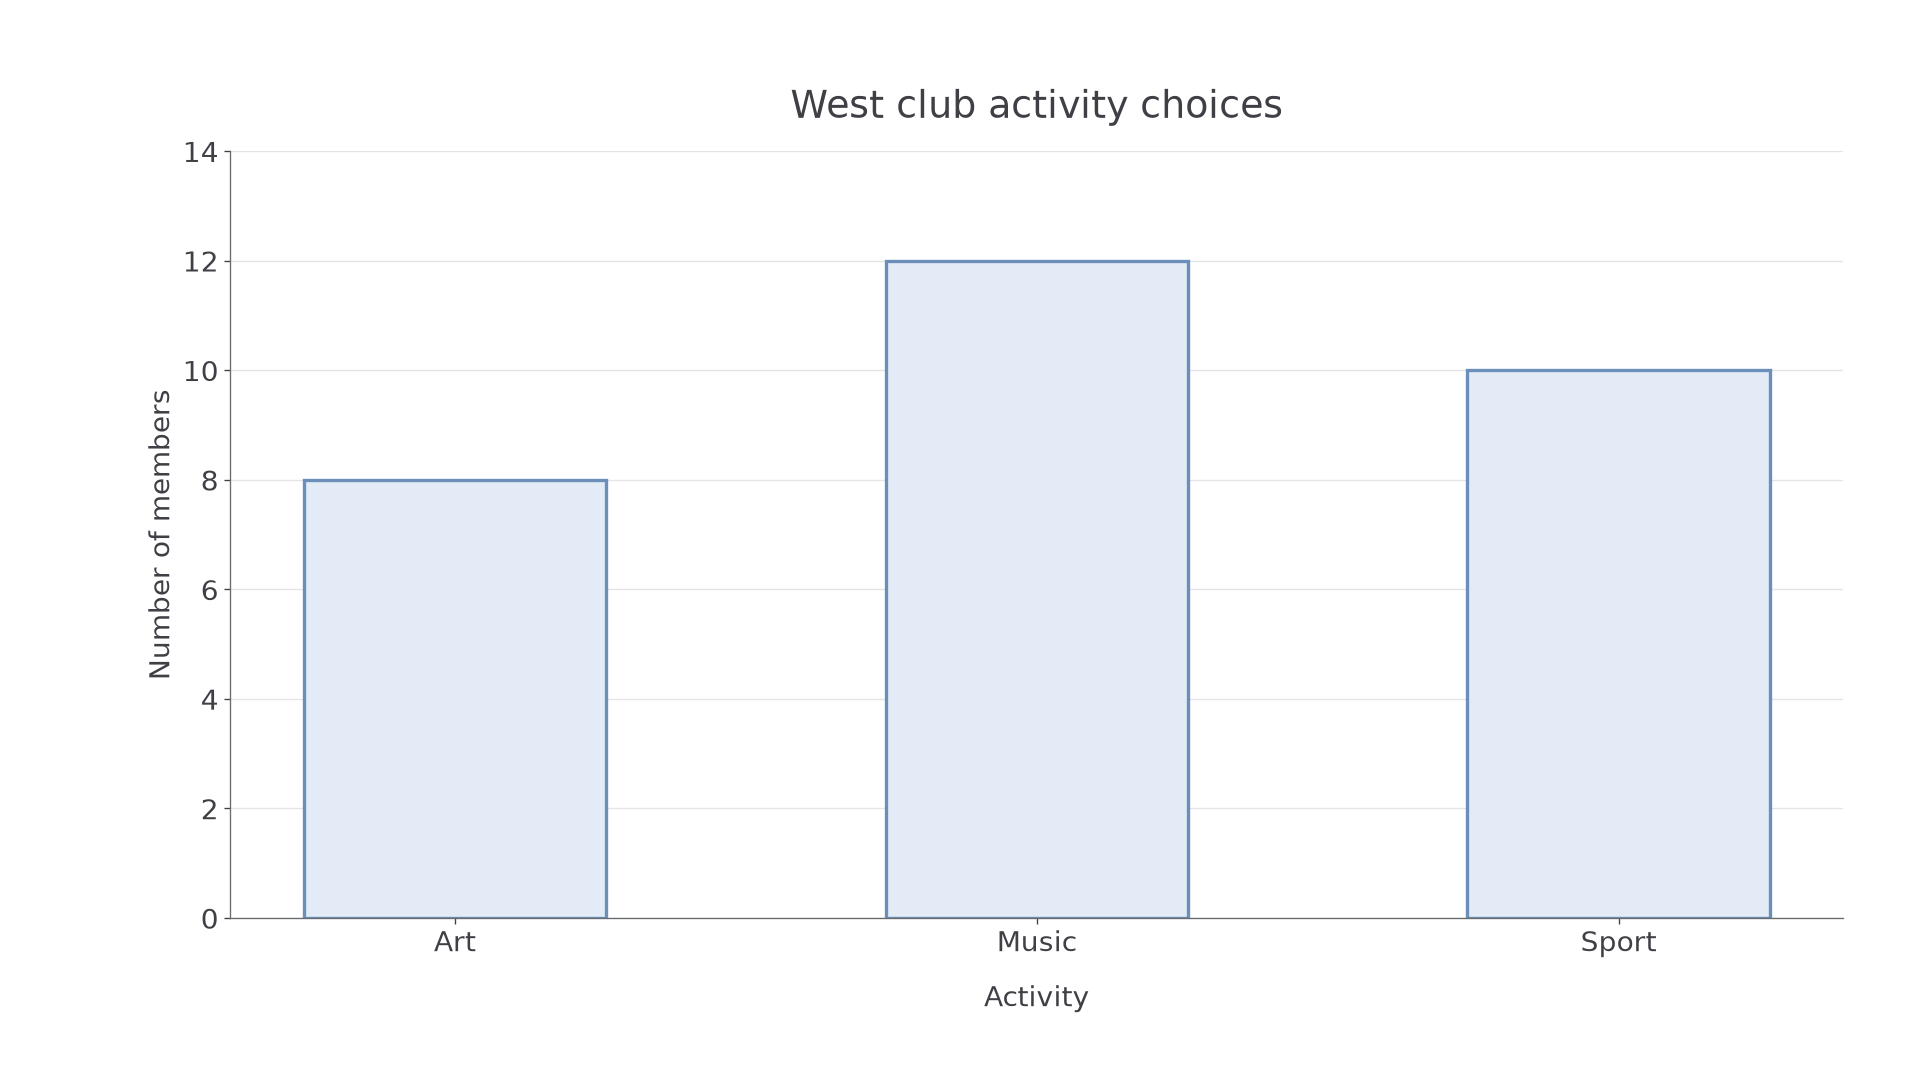
Check. Read the heights back from the axis: . Their total agrees with the table, and music is the tallest bar because twelve is the largest frequency.
Now add East club. A dual bar chart places the two groups side by side within each category. A composite, or stacked, bar chart places one group's segment above the other. Both need a key. A stacked segment's frequency is its top reading minus its bottom reading; only the bottom segment starts at zero.
Worked example 2: adding a second data set
Question. Display the two clubs' choices using a dual chart and a stacked chart. Find the combined sport frequency.
| Activity | Art | Music | Sport |
|---|---|---|---|
| West | |||
| East |
Plan. Keep West's frequencies; add East alongside them for a dual chart, or above them for a stacked chart.
[DIAGRAM: asset_name: Dual and stacked club charts; asset_slug: dual_stacked_clubs; caption: Dual bars compare groups directly; stacked bars show their combined totals.; description: Two complete charts share activity categories Art Music Sport and a zero-based frequency scale marked every two to twenty-six. Blue represents West with frequencies eight twelve ten and green represents East with frequencies six eight fourteen. The left chart uses side-by-side bars and the right stacks East above West, giving tops fourteen twenty twenty-four. Both show a labelled key.]
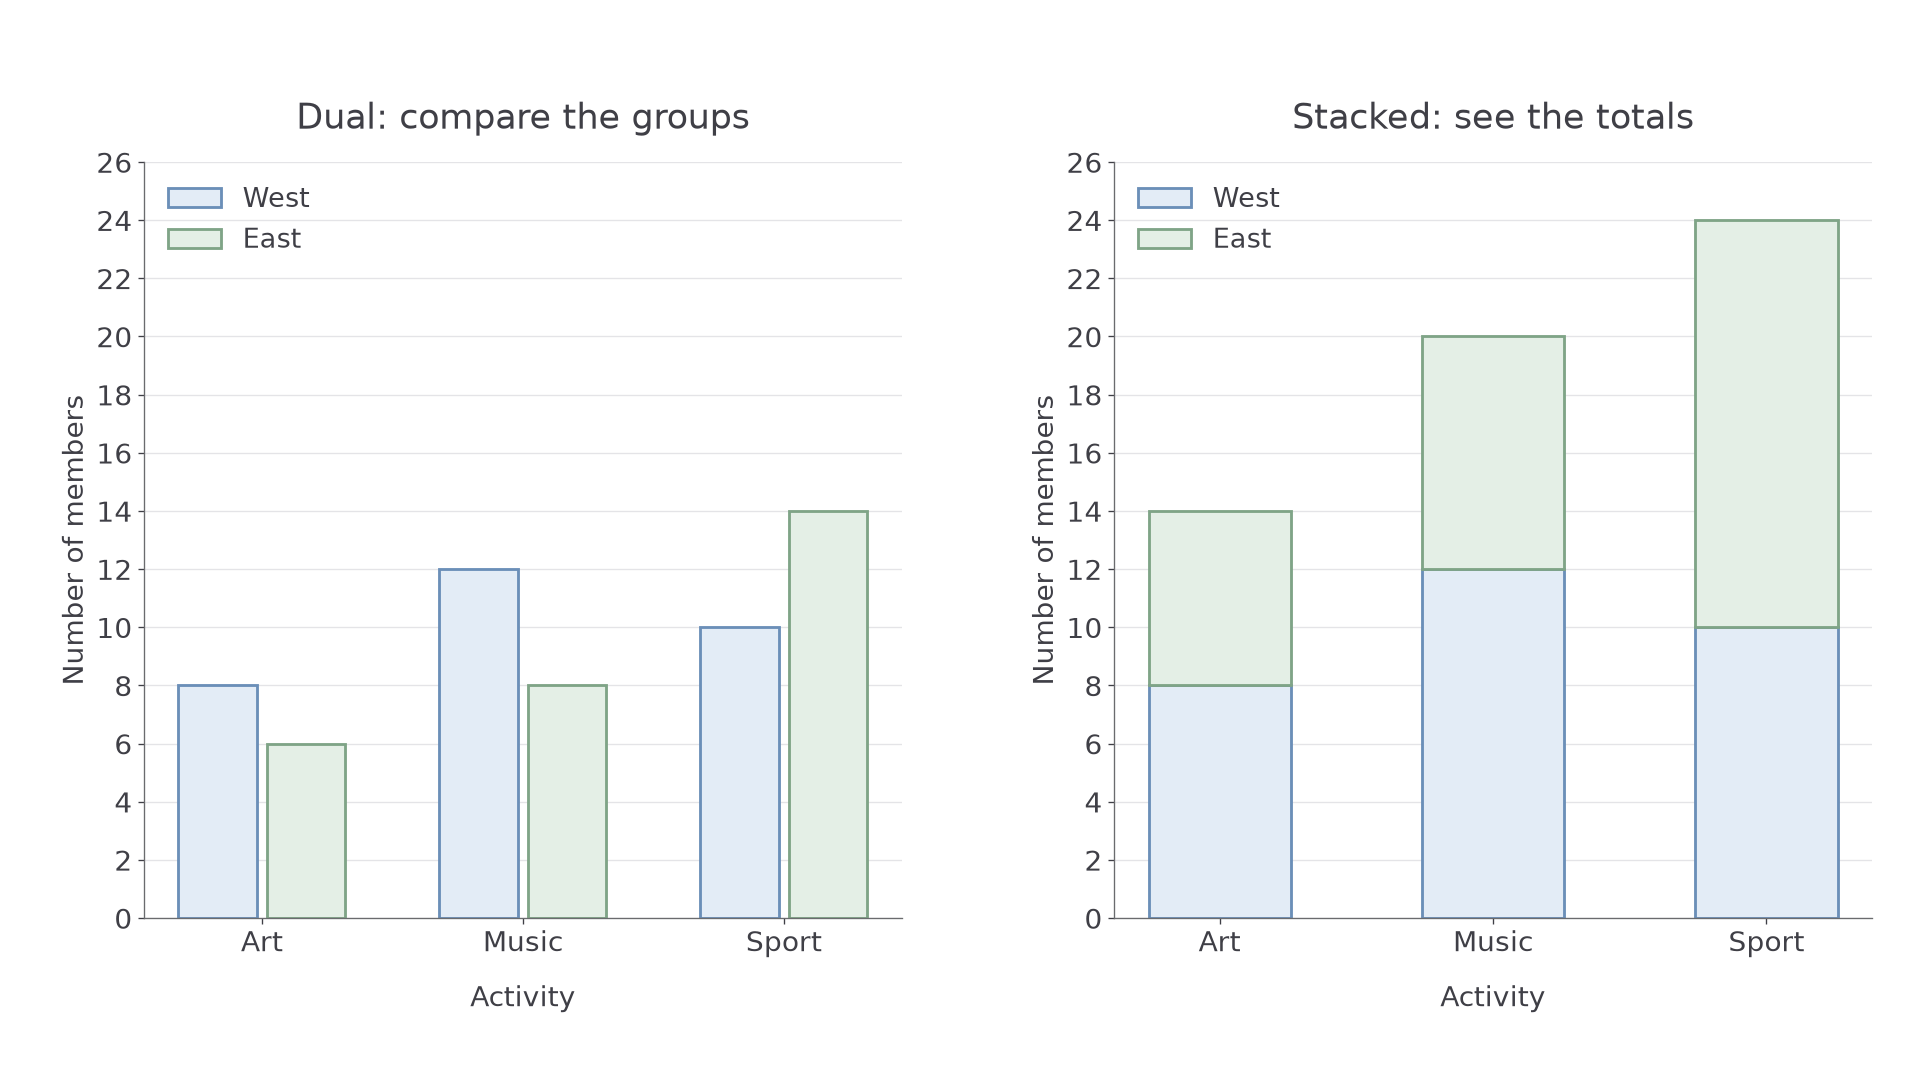
Answer. Sport has members altogether. In its stacked bar, East's segment runs from to , so its frequency is .
Check. The stacked totals sum to , equal to West's plus East's . The dual chart gives the same six individual frequencies.
Watch out
“East has sport members” reads the top of a stack as a segment. Subtract the lower reading: . Also check the scale: one drawn interval need not represent one member.
Use a new stacked-bar situation. All readings needed are in the question.
Pie charts and sector angles
A pie chart divides one whole into sectors. A half of the observations takes half the full turn, so it has angle . A pie chart shows proportions; equal-sized sectors in two charts do not imply equal numbers unless the totals are equal.
Pie-chart proportions
For a nonzero total frequency,
and
All sectors together have angle . These relationships are not given in the List of formulas: learn them.
To draw the chart, calculate all angles first. Draw a circle and a starting radius. Use a protractor at the centre to measure each sector from the preceding radius. Label the categories or provide a key; give the total when a reader needs frequencies.
Worked example 3: drawing sectors from frequencies
Question. Twenty-four members choose a drink: water , juice , milk . Draw a pie chart.
Plan. Find each category's fraction of the twenty-four members, then give it that fraction of a full turn.
[DIAGRAM: asset_name: Drink choices as sectors; asset_slug: drinks_pie; caption: Each sector has the same fraction of the turn as its category has of the members.; description: A complete circle divided into water one hundred eighty degrees, juice one hundred twenty degrees and milk sixty degrees. Each sector is labelled with its category, frequency twelve eight or four, and angle. The title states twenty-four members. The circle centre and radii are visible.]
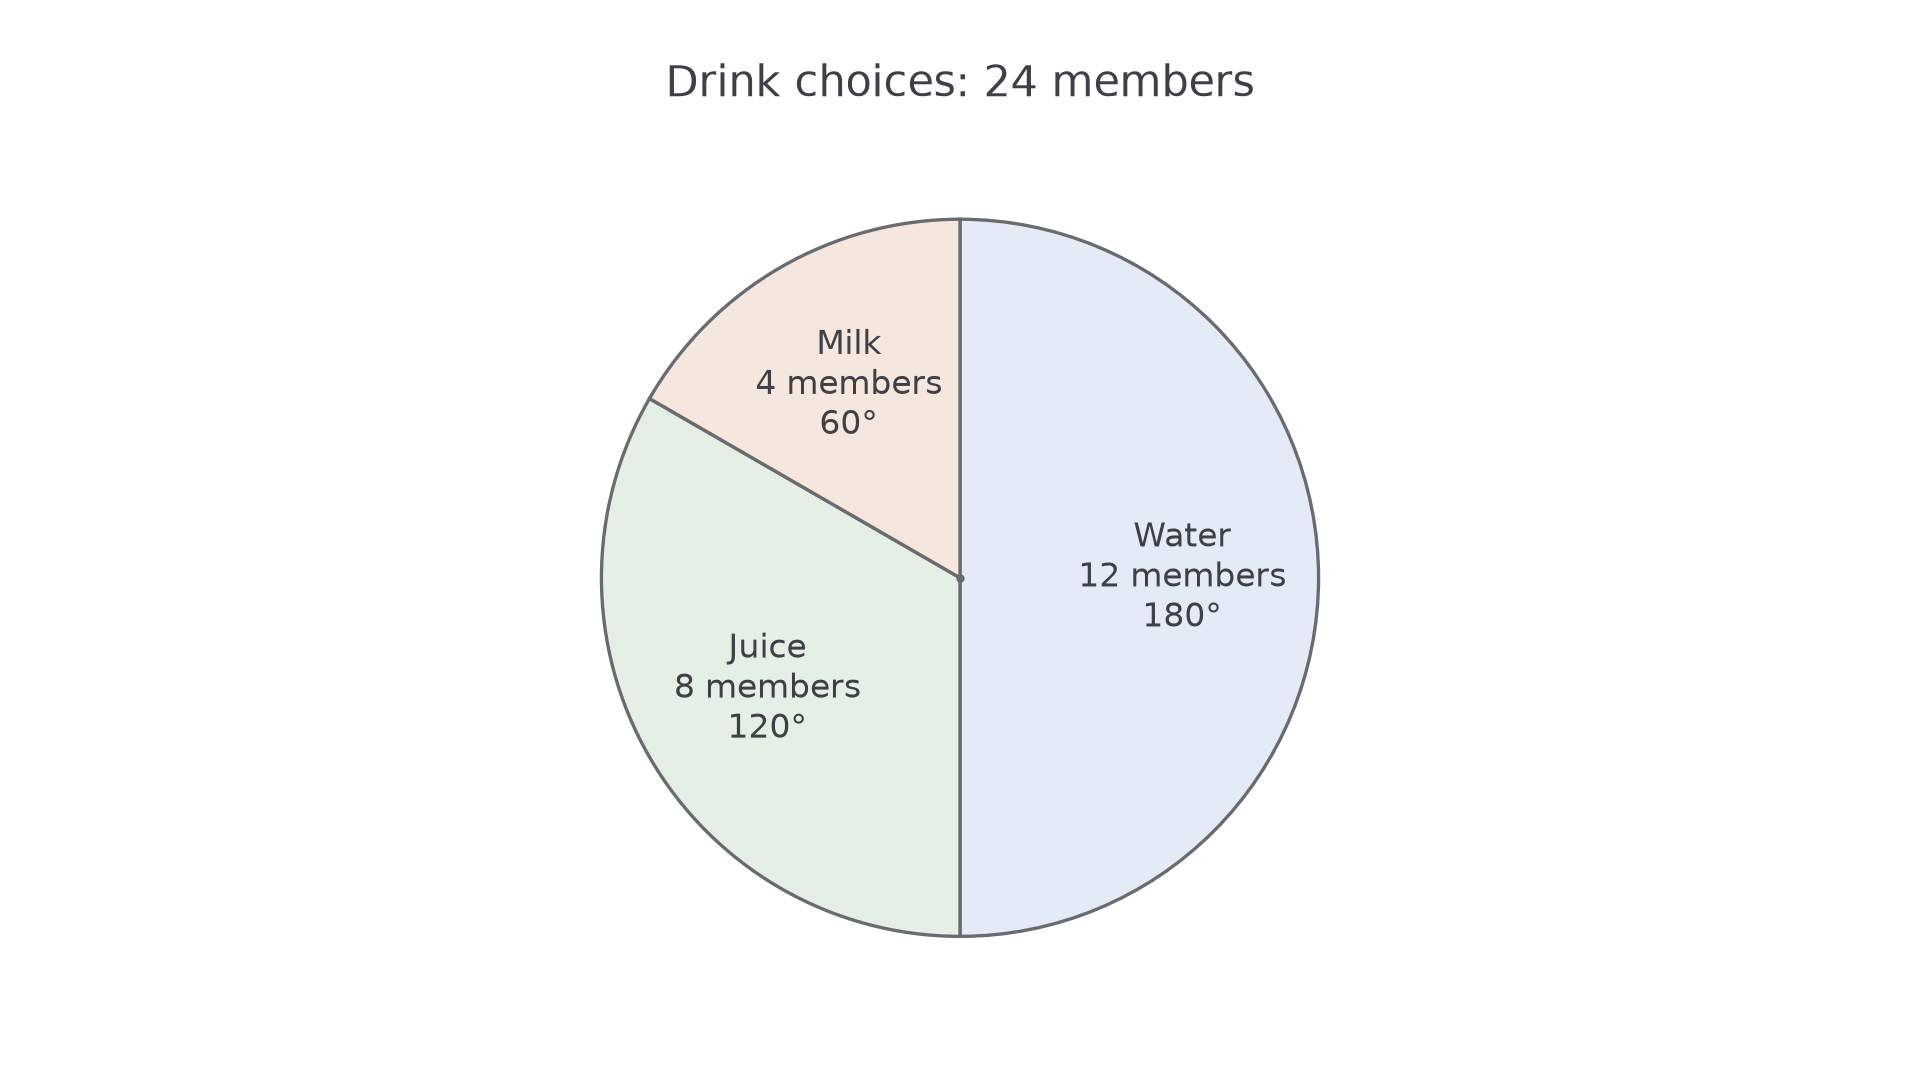
Answer. Draw sectors of , labelled water, juice and milk.
Check. Their angles add to . The water sector is a semicircle, matching twelve of the twenty-four members.
Continue this lesson.
You’re previewing NovaLearn without an account. Create a free account to read the rest.
Create free account