C9.5; E9.5 - Scatter diagrams and correlation
A scatter diagram keeps two measurements from the same person or object together. You will plot paired data, recognise correlation, and use a straight line of best fit for cautious estimates within the observed range.
Plotting paired data
If pupils who revise for longer tend to score more highly, does the pattern predict everyone's exact score? Plotting each pupil's paired measurements lets you see both a possible trend and the variation around it.
A scatter diagram plots two numerical variables measured on each individual. Choose one variable for each labelled axis, include units and use a scale that makes accurate plotting possible. A small clear cross marks each pair. Its horizontal and vertical coordinates must come from the same individual.
Unlike a graph of a journey over time, these points represent separate individuals. Do not join them in collection order: that would invent a path between people.
Worked example 1: keeping measurements paired
Question. Plot the revision times and scores of these five pupils.
| Pupil | A | B | C | D | E |
|---|---|---|---|---|---|
| Revision time, hours | |||||
| Score |
Plan. Put revision time on the horizontal axis and score on the vertical axis, then plot one cross per column.
Answer. The left panel of the diagram below shows the five crosses on labelled scales.
Check. There are five table columns and five plotted crosses. The cross at horizontal coordinate four has height sixty-four, matching D's column rather than a different pupil's score.
Add one pupil with a non-integer revision time. The axis scale, rather than the table's whole-number entries, determines where the new cross belongs.
Worked example 2: adding an intermediate coordinate
Question. Pupil F revises for hours and scores . Add F to the diagram.
Plan. Locate halfway between two and three hours, then move vertically to score fifty-five.
Answer. The right panel includes F's cross at , with the original five crosses retained.
Check. F is horizontally between B and C but vertically above both their scores, forty-nine and fifty-one. That is allowed: paired observations need not follow a perfectly increasing sequence.
[DIAGRAM: asset_name: Plotting paired revision data; asset_slug: scatter_paired_data; caption: Each cross keeps one pupil's revision time and score together.; description: Two equal-scale scatter panels have horizontal Revision time hours from zero to six and vertical Score from thirty to eighty. The first panel shows five labelled crosses A one thirty-eight B two forty-nine C three fifty-one D four sixty-four and E five sixty-eight. The second repeats them and adds green F at two point five fifty-five with light guides to both axes. Points are not joined.]
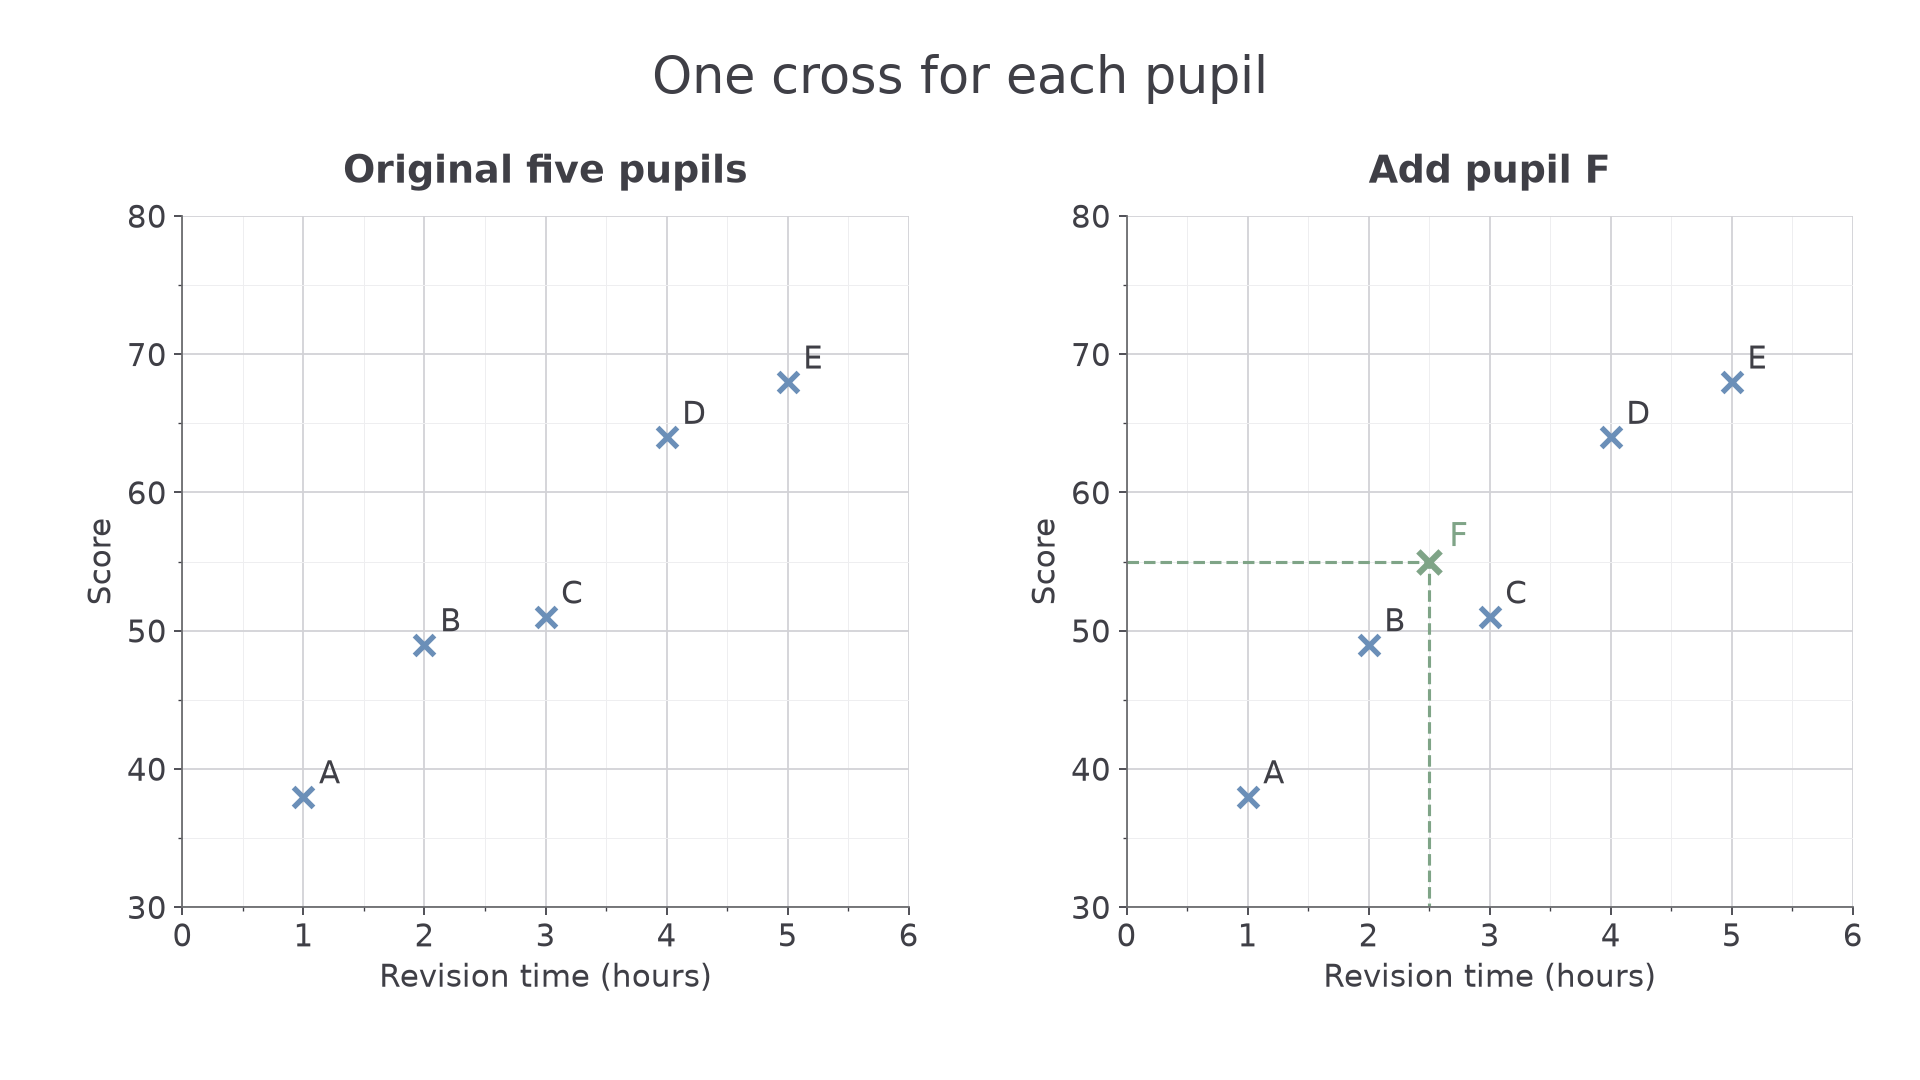
The axes let you retrieve each original pair from its cross. Retaining that link is what makes the display useful for investigating an association.
Watch out
Sorting the two rows separately destroys the original pairs. Plot from each column. A scatter point is one individual, not the frequency of everyone with that time.
Interpret the axes in a new context.
Positive, negative and zero correlation
Read a scatter diagram from left to right and look for the overall pattern, rather than demanding that every successive point rises or falls. Correlation describes an association between the two variables.
Types of correlation
With positive correlation, larger values of one variable tend to go with larger values of the other. With negative correlation, larger values of one tend to go with smaller values of the other. Zero correlation describes no apparent straight-line trend. It does not mean that all the values are zero, and it does not rule out every possible curved relationship.
[DIAGRAM: asset_name: Three correlation patterns; asset_slug: scatter_correlation_patterns; caption: Look for the overall trend across the cloud of points.; description: Three panels with numerical x and y axes from zero to ten show clear crosses. The Positive correlation panel has an upward cloud, the Negative correlation panel has a downward cloud, and the Zero correlation panel has a spread with no apparent upward or downward trend. None of the points are joined. The same blue cross style is used throughout.]
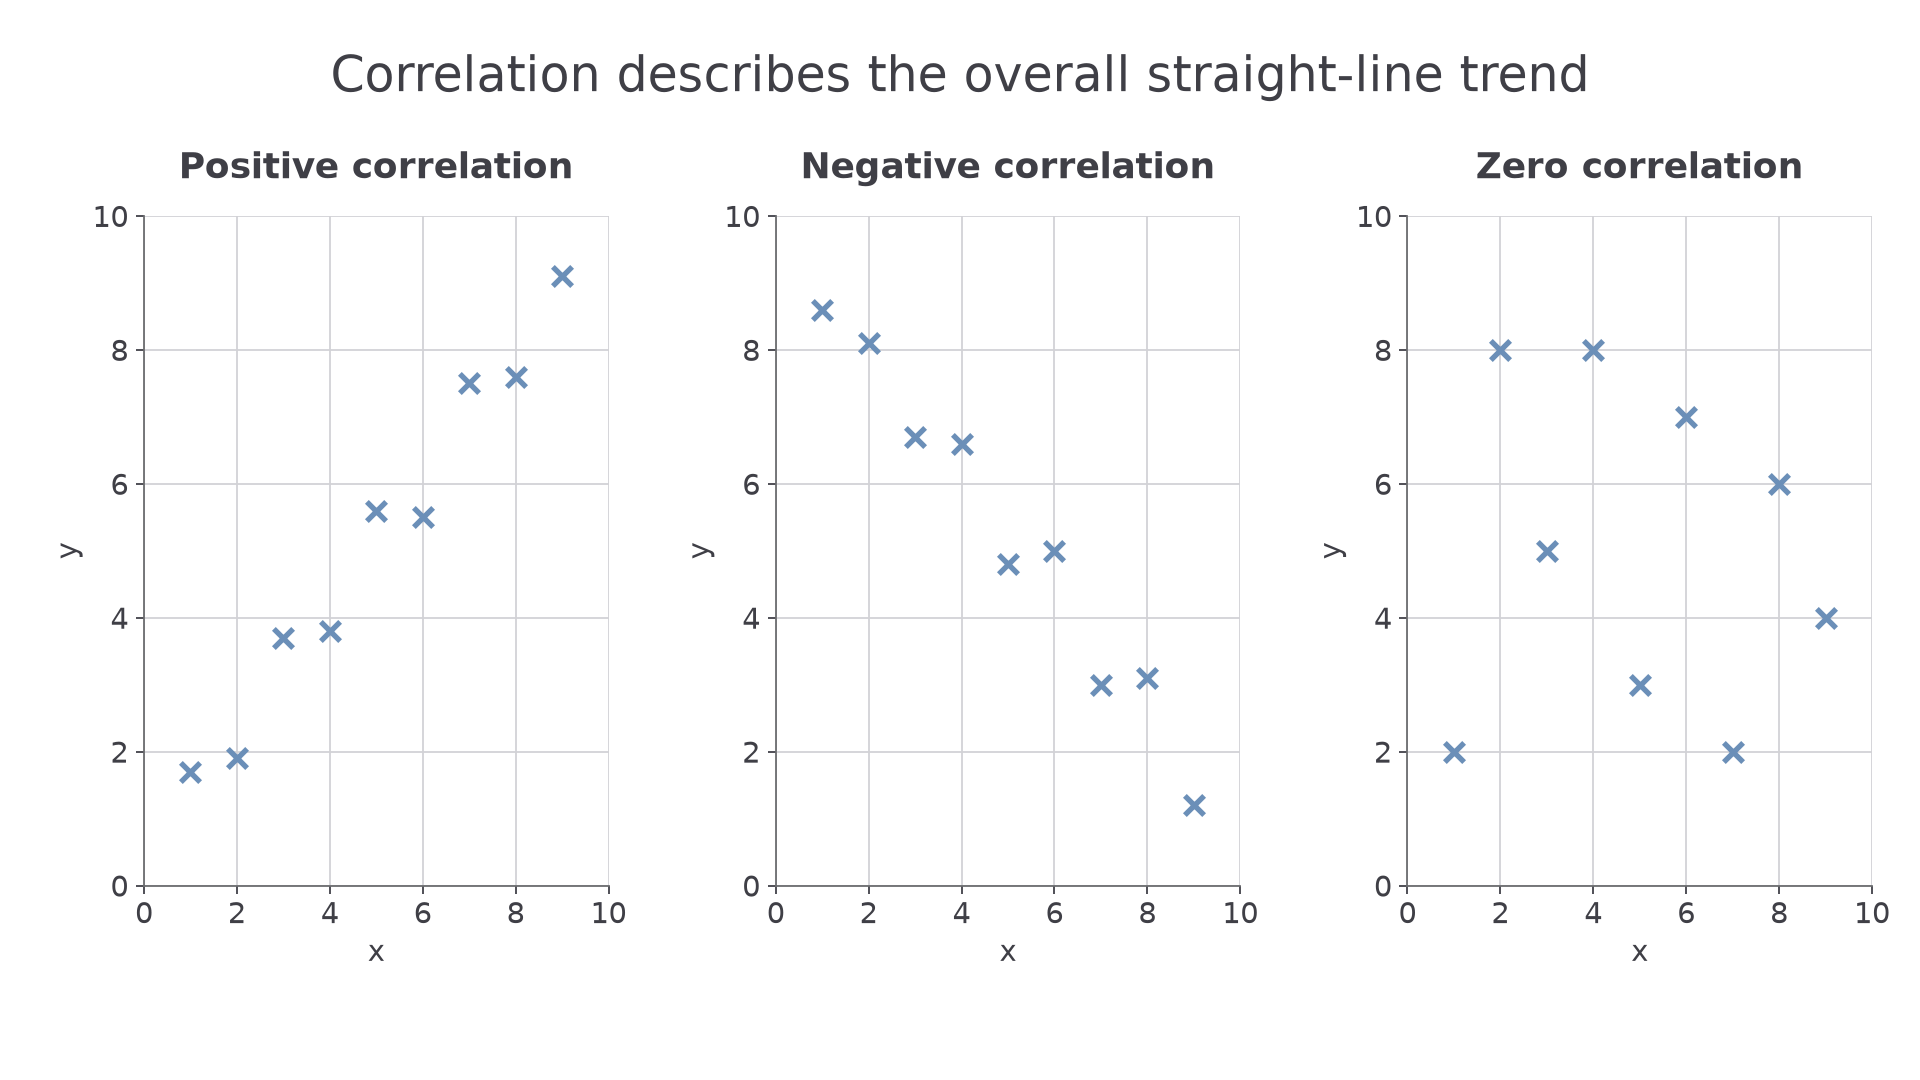
In the first panel, the vertical values tend to increase as the horizontal values increase. The points need not lie exactly on a straight line. In the second, the vertical values tend to decrease. The third has no evident straight-line trend: neither an upward nor a downward sloping line would describe its points well.
Points closer to a straight trend show a stronger straight-line association. A few exceptions do not automatically remove a trend. Conversely, the sign of correlation does not describe whether a situation is desirable: a negative association between practice time and errors could be useful.
Correlation alone does not establish causation. Suppose children with larger shoe sizes tend to read longer books. Growing older could help explain both changes; the scatter diagram alone does not show that buying larger shoes improves reading. Look for other explanations before claiming a cause.
Continue this lesson.
You’re previewing NovaLearn without an account. Create a free account to read the rest.
Create free account