C2.10; E2.10 - Plotting quadratic and reciprocal graphs
A table of values can reveal a curve, but the way you join its points matters. You will calculate and plot quadratic and reciprocal graphs, handle an excluded input and read roots and intersections to solve equations graphically for C2.10 and E2.10.
Tables and accurate quadratic curves
Why is joining every pair of neighbouring points with a ruler sometimes wrong? For a line, equal input changes give equal output changes. For a rule involving a square, those changes usually vary. The graph bends between its calculated points.
You already know linear rules such as . At inputs , the outputs lie on one ruled line. A quadratic rule contains an term with non-zero coefficient. Here we begin with coefficient or , and integer coefficients in the remaining terms.
Quadratic curve
A quadratic graph is a parabola, a smooth curve with two arms. A positive coefficient gives an upward-opening curve; a negative coefficient gives a downward-opening curve. Calculate enough points across the requested interval to show its shape.
Square a negative input inside brackets: , whereas . Work out powers before multiplying coefficients or adding terms. Label axes, choose even scales, plot accurately and draw one smooth curve through the points, rather than a sequence of ruled segments.
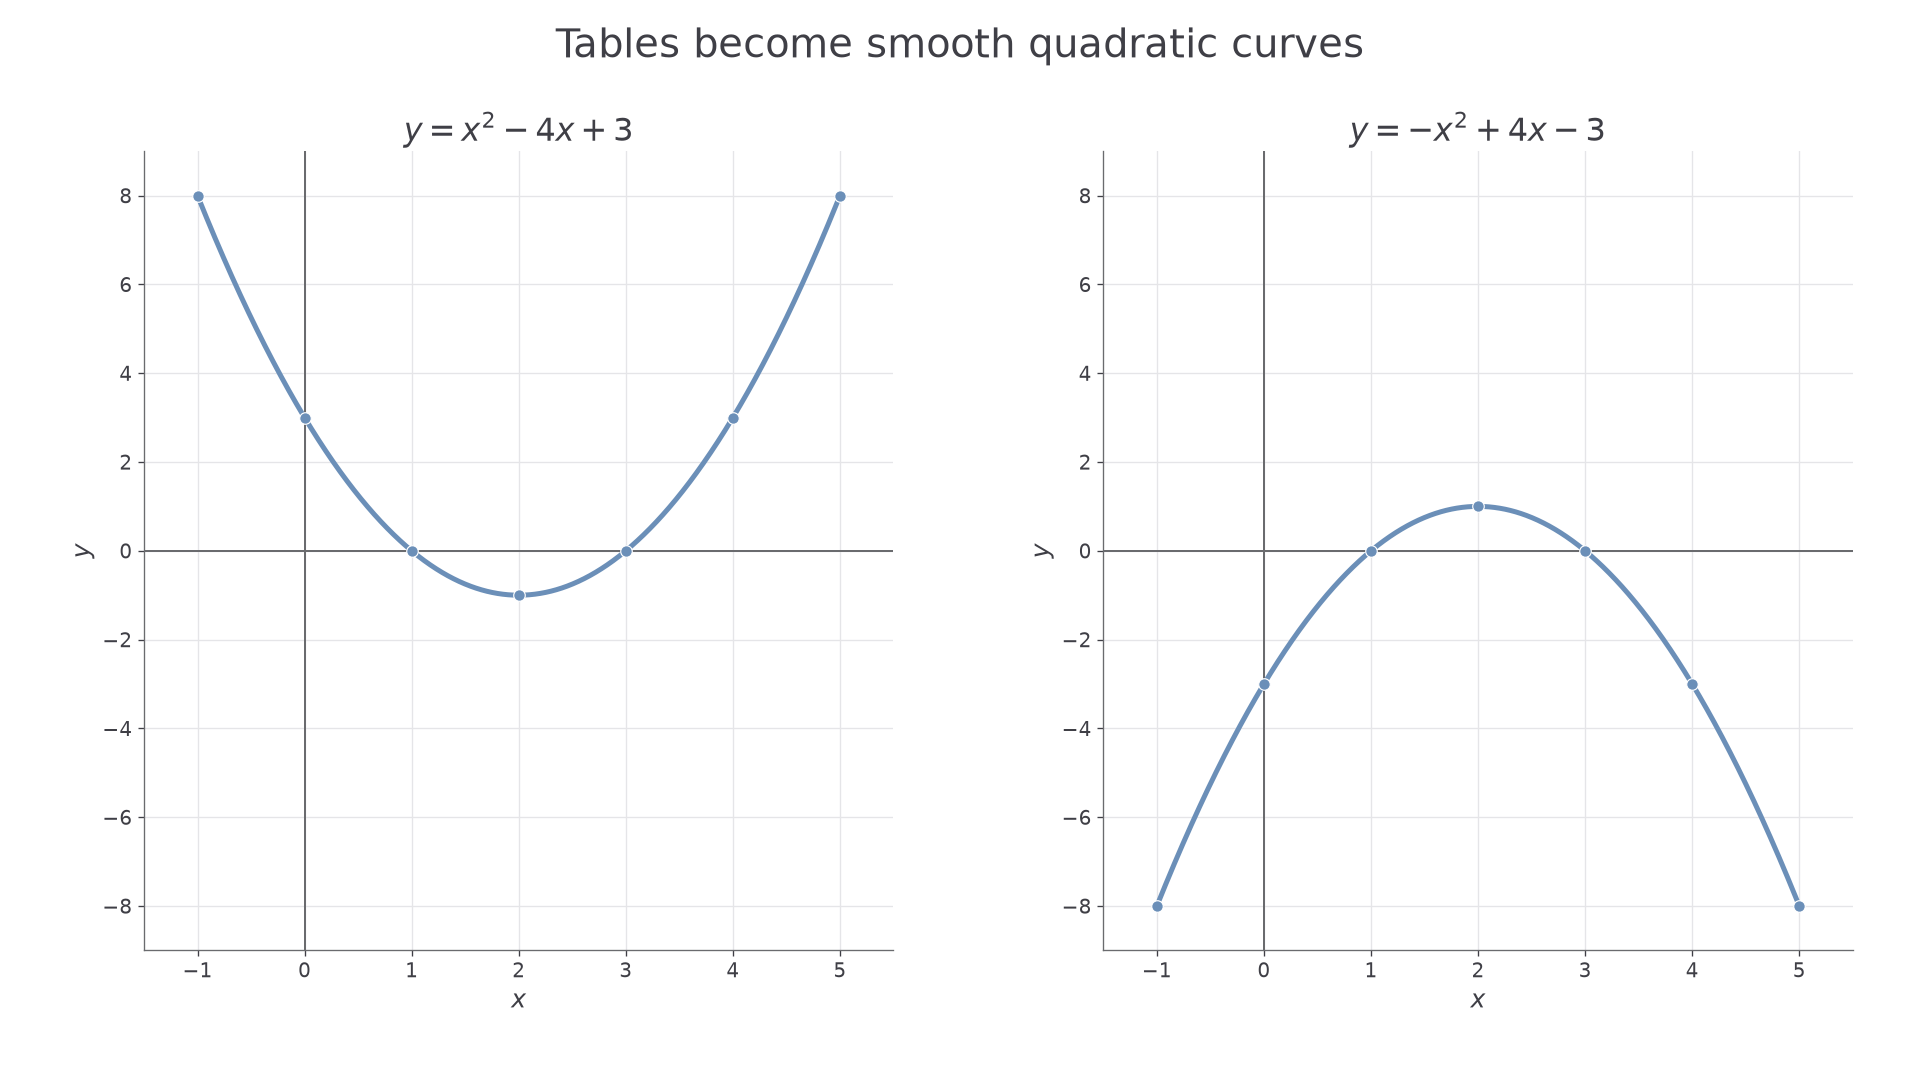
[DIAGRAM: asset_name: Accurate quadratic plots; asset_slug: quadratic_tables; caption: Negating every output reflects the curve across the horizontal axis.; description: Two numbered coordinate grids use the same scales and show plotted integer-input points from negative one to five. The left curve is y equals x squared minus four x plus three, with outputs eight, three, zero, negative one, zero, three, eight. The right curve is y equals negative x squared plus four x minus three, with the opposite outputs. Smooth curves pass through every point.]
Worked example 1: an upward-opening curve
Question. Make a table for , for integer from to , and draw its graph.
Plan. Calculate each output in the same operation order, then plot and join smoothly.
Answer. Plot the seven ordered pairs and draw the left smooth curve over the requested interval.
Check. An unused input gives . The curve passes just below the horizontal axis there. Outputs at equal distances either side of match.
Change only the sign of the complete output. This predicts the second table before you recalculate it.
Worked example 2: the reflected curve
Question. Make the corresponding table and graph for .
Plan. Negate every output, then check the calculation at a negative input.
Answer. Plot these pairs and join them with the downward-opening smooth curve in the right grid.
Check. At the fresh input , the output is , the opposite of the first curve's output. Both graphs still cross the horizontal axis at the same inputs, because negating zero leaves zero.
Watch out
A table is a collection of points, not a command to use a ruler. Use a ruled line for a linear rule and a smooth curve for a quadratic. If one point breaks the shape, recheck its arithmetic before drawing a kink.
Reciprocal curves and excluded zero
For , doubling a non-zero input halves the output. This is a reciprocal relationship rather than a quadratic. The input zero needs special care: dividing by zero is undefined. A blank at zero is not a point with output zero.
Reciprocal graph
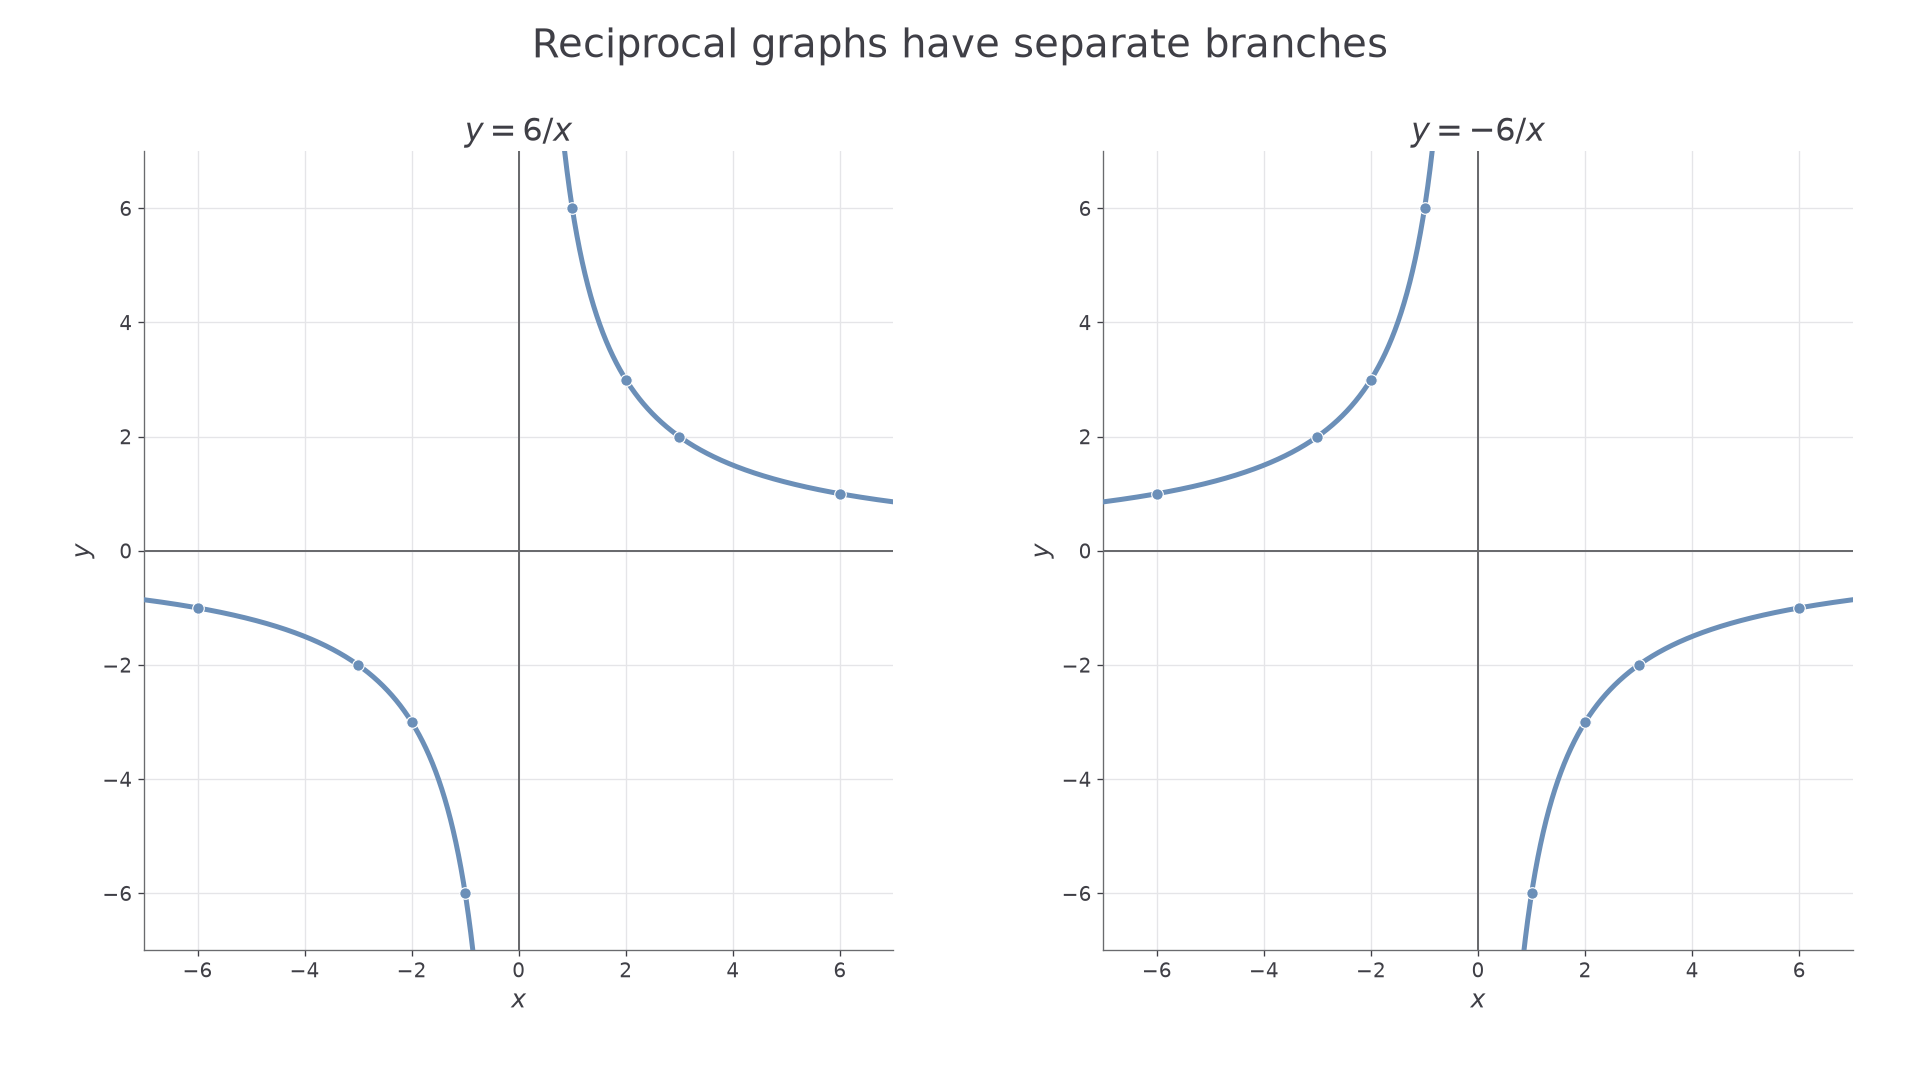
For , . When , there are two separate branches. If , input and output have the same sign; if , their signs are opposite. Neither branch meets an axis. Draw each branch smoothly and never join them through zero.
[DIAGRAM: asset_name: Separate reciprocal branches; asset_slug: reciprocal_branches; caption: Zero is excluded; the two branches are not joined across the vertical axis.; description: Two numbered coordinate grids show the smooth branches of y equals six divided by x and y equals negative six divided by x. Points at inputs negative six, negative three, negative two, negative one, one, two, three and six are marked. The axes are approached by the branches but not crossed.]
Worked example 3: a positive numerator
Question. Calculate values for at , and describe the graph.
Plan. Divide six by each signed input, then plot the negative and positive branches separately.
Answer. Draw one branch in quadrant III and one in quadrant I, as in the left graph. Do not plot .
Check. Every plotted pair has product . A new point also satisfies this product and lies between the neighbouring plotted points on the positive branch.
Continue this lesson.
You’re previewing NovaLearn without an account. Create a free account to read the rest.
Create free account