C8.1; E8.1 - Single-event probability
Probability measures chance on a scale from impossible to certain. For Core and Extended, C8.1/E8.1 connects that scale to equally likely outcomes and information in tables, graphs and two-set Venn diagrams. You will calculate single-event probabilities and use complements to find the chance that an event does not happen.
Probability scale and equally likely outcomes
A bag contains three red counters and one blue counter. Is blue just as likely as red because there are two colours? Imagine choosing one counter with each individual counter equally likely. Three of the four possible counters are red: counting colour names would miss the different numbers of counters.
Outcome, event and probability
An outcome is one possible result of an experiment. An event is a specified collection of outcomes, such as “the counter is red”. Its probability measures how likely the event is, from for impossible to for certain.
For equally likely outcomes in a finite complete list,
“Favourable” means it satisfies the event, whether or not you personally want it to happen.
For the bag, red has probability and blue . A probability may also be a decimal or percentage: . These describe the same chance, not three different predictions.
[DIAGRAM: asset_name: The probability scale; asset_slug: probability_scale; caption: Probabilities run from zero to one, with an even chance at one half.; description: A horizontal evenly spaced scale from 0 to 1 has marked positions 0, one quarter, one half, three quarters and 1. The endpoints are labelled impossible and certain, the centre even chance, and the quarter and three-quarter positions less likely and more likely than not.]
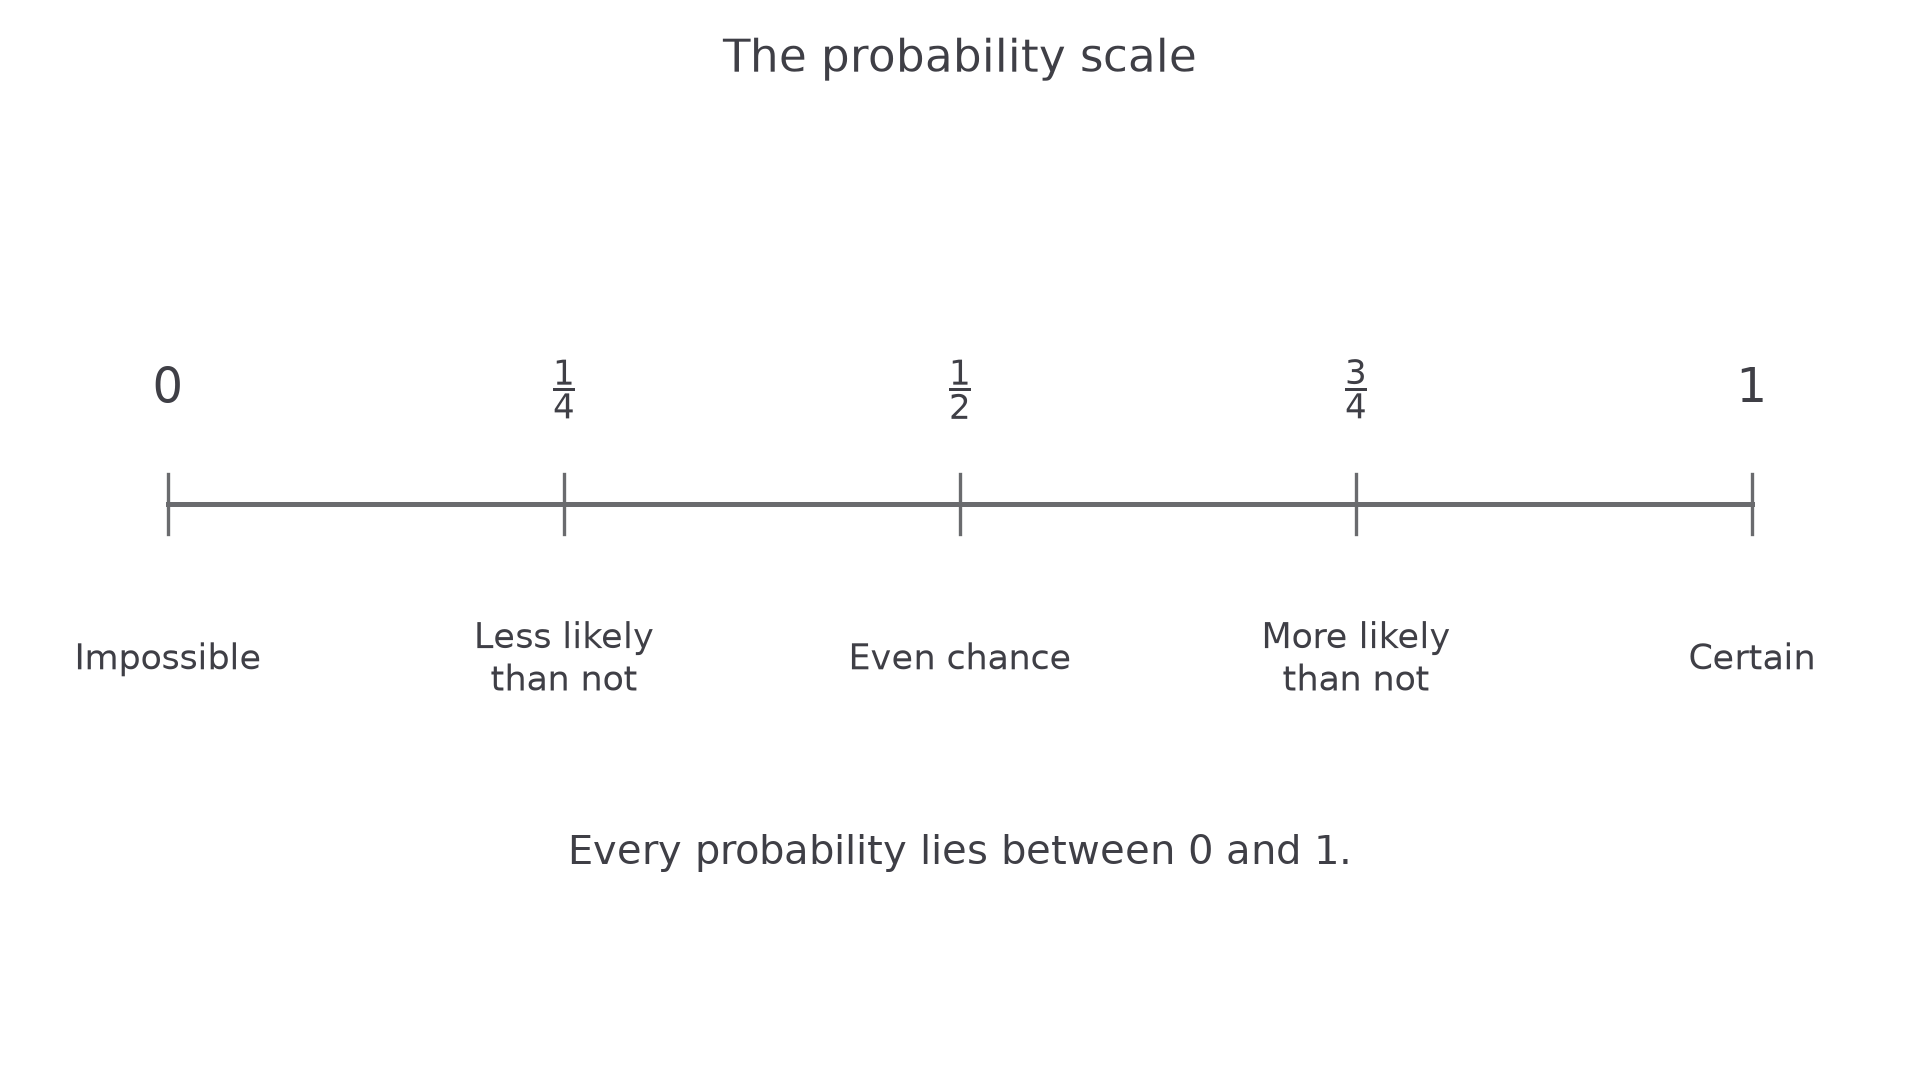
An event with probability has an even chance. A probability below is less likely to happen than not; one above is more likely to happen than not. Values such as and cannot be probabilities.
Worked example 1: equally likely die faces
Question. A fair six-sided die is numbered to . Find the probability of rolling .
Plan. Count the favourable faces among the six equally likely faces.
Answer. .
Check. Each of the six face events has probability , and , accounting for every possible roll.
Keep the die, but change only the event. One event can contain several outcomes.
Worked example 2: an event with several outcomes
Question. Find the probability of rolling a number greater than on the same die.
Plan. List the favourable faces before forming the fraction.
Answer. .
Check. The other four faces give probability ; together .
The equal-chance condition matters. On a biased die, the six face labels still exist, but dividing by six need not give their probabilities. You would need information about their actual chances. Random means the particular result is uncertain; it does not by itself make a chosen list of categories equally likely.
Watch out
“Red or blue, so the probability of blue is ” is wrong for the opening bag. The four counters are equally likely, while the two colours are not. The correct probability is .
For the die below, the equal-chance condition is supplied; identify the favourable faces.
Counting a single event
When choosing a person at random from a group, make the intended model explicit: every person is equally likely to be chosen. Then a table, bar chart or Venn diagram can supply the favourable count and the whole-group count. Read what the numbers represent before calculating.
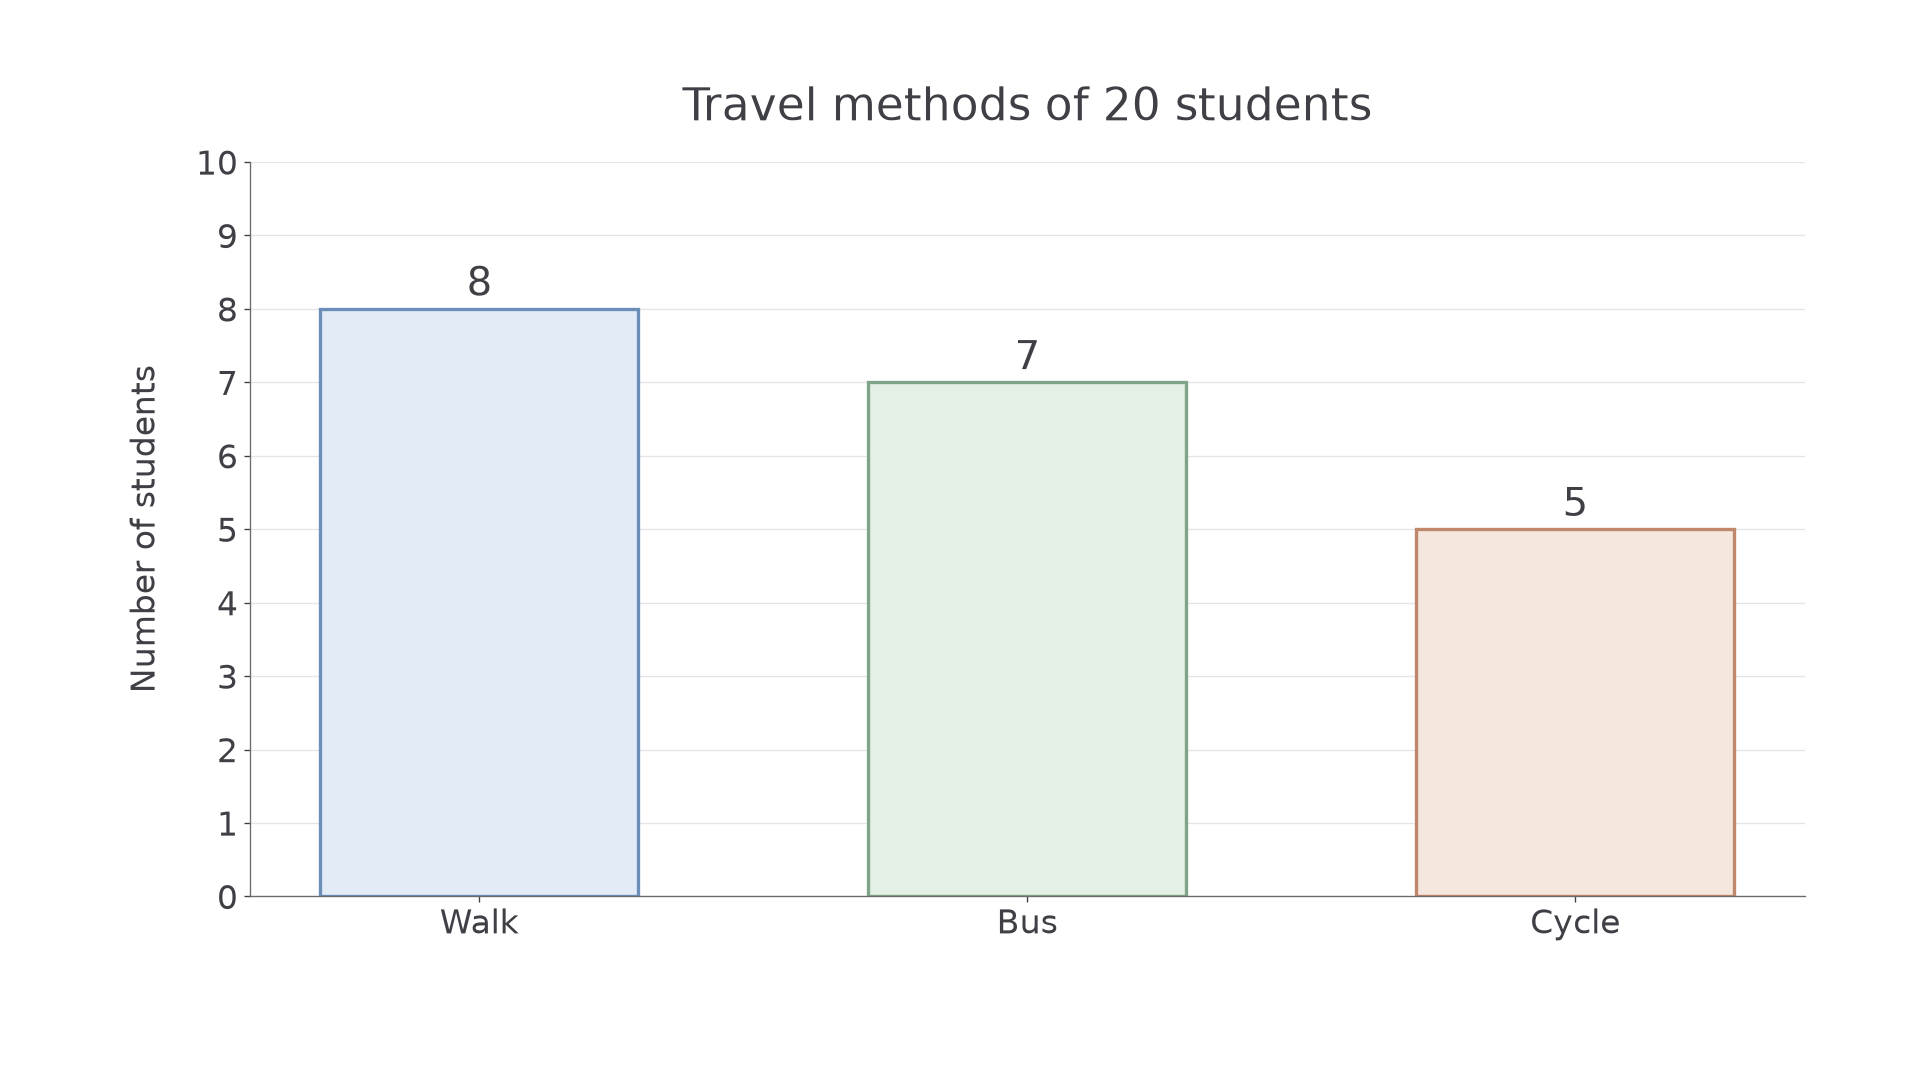
The chart shows the travel methods of students. Each student is in exactly one category, so the bar heights add to the total.
[DIAGRAM: asset_name: Travel-method counts; asset_slug: probability_travel_counts; caption: Use the frequency scale to count students, rather than counting the three bars.; description: A bar chart has categories Walk, Bus and Cycle with frequencies 8, 7 and 5. The vertical frequency axis starts at zero, is marked in steps of one and reaches ten. Each bar has its frequency printed above it.]
Worked example 3: reading a bar chart
Question. One of these students is chosen, each equally likely. Find the probability that the student cycles.
Plan. Read the cycle count and divide by the total number of students.
Answer. .
Check. Five is one quarter of twenty, and the other students form the remaining three quarters.
Continue this lesson.
You’re previewing NovaLearn without an account. Create a free account to read the rest.
Create free account