C9.1; E9.1 - Classifying and organising data
A list of observations becomes useful when you know what each value means and where it belongs. You will distinguish types of data, record frequencies without losing observations, and use two-way tables to keep two classifications together.
Classifying observations
Can a number be a label rather than an amount? The number on a bus identifies a route: adding bus numbers does not tell you how many buses there are. Start by asking what was observed, rather than judging the data by its appearance.
A variable is a characteristic being recorded, such as eye colour, number of pets or journey time. One recorded value is an observation. Collecting the same variable for several people or objects gives a set of data.
Types of data
Categorical data describe groups or labels, such as travel method or shirt size. A numerical code used only as a label is categorical too.
Discrete numerical data take separate possible values, usually from counting: a family can have pets, but not pets.
Continuous numerical data can take any value in a suitable interval, such as height or time. Measuring to the nearest centimetre rounds the recorded value; height itself is still continuous.
Shoe sizes have separate allowed values even though some include halves. They are discrete numerical data. Shirt sizes small, medium and large are ordered categories: an order does not turn the labels into measured amounts.
Before recording observations, choose categories that do not overlap and cover every possible response you allow. For a single main travel method, “walk”, “bus”, “cycle” and “other” let each person appear once. If someone walks to a bus stop, ask for their main method so the rule is clear.
For measured times, “under minutes” and “ minutes or more” give one unambiguous home. “ to ” and “ to ” are ambiguous unless you say which boundary is included. A missing response is not automatically the numerical value zero: record “no response” separately when needed.
Key idea
Classify the variable by what its values mean. Rounding a measurement does not turn the underlying continuous variable into a count.
Now test the distinction with two observations that happen to be written as numbers.
Tally and frequency tables
A tally records each observation as you read it, so you do not need to hold a running total in your head. Put the fifth stroke across the previous four: completed groups of five are quick to count. The frequency is the number of observations in that category, including a frequency of zero for an allowed category that did not occur.
[DIAGRAM: asset_name: Counting with groups of five; asset_slug: tally_groups; caption: A crossed group contains five tally strokes.; description: Three labelled rows show four separate tally strokes for frequency four, a crossed group of five for frequency five, and one crossed group plus two separate strokes for frequency seven.]
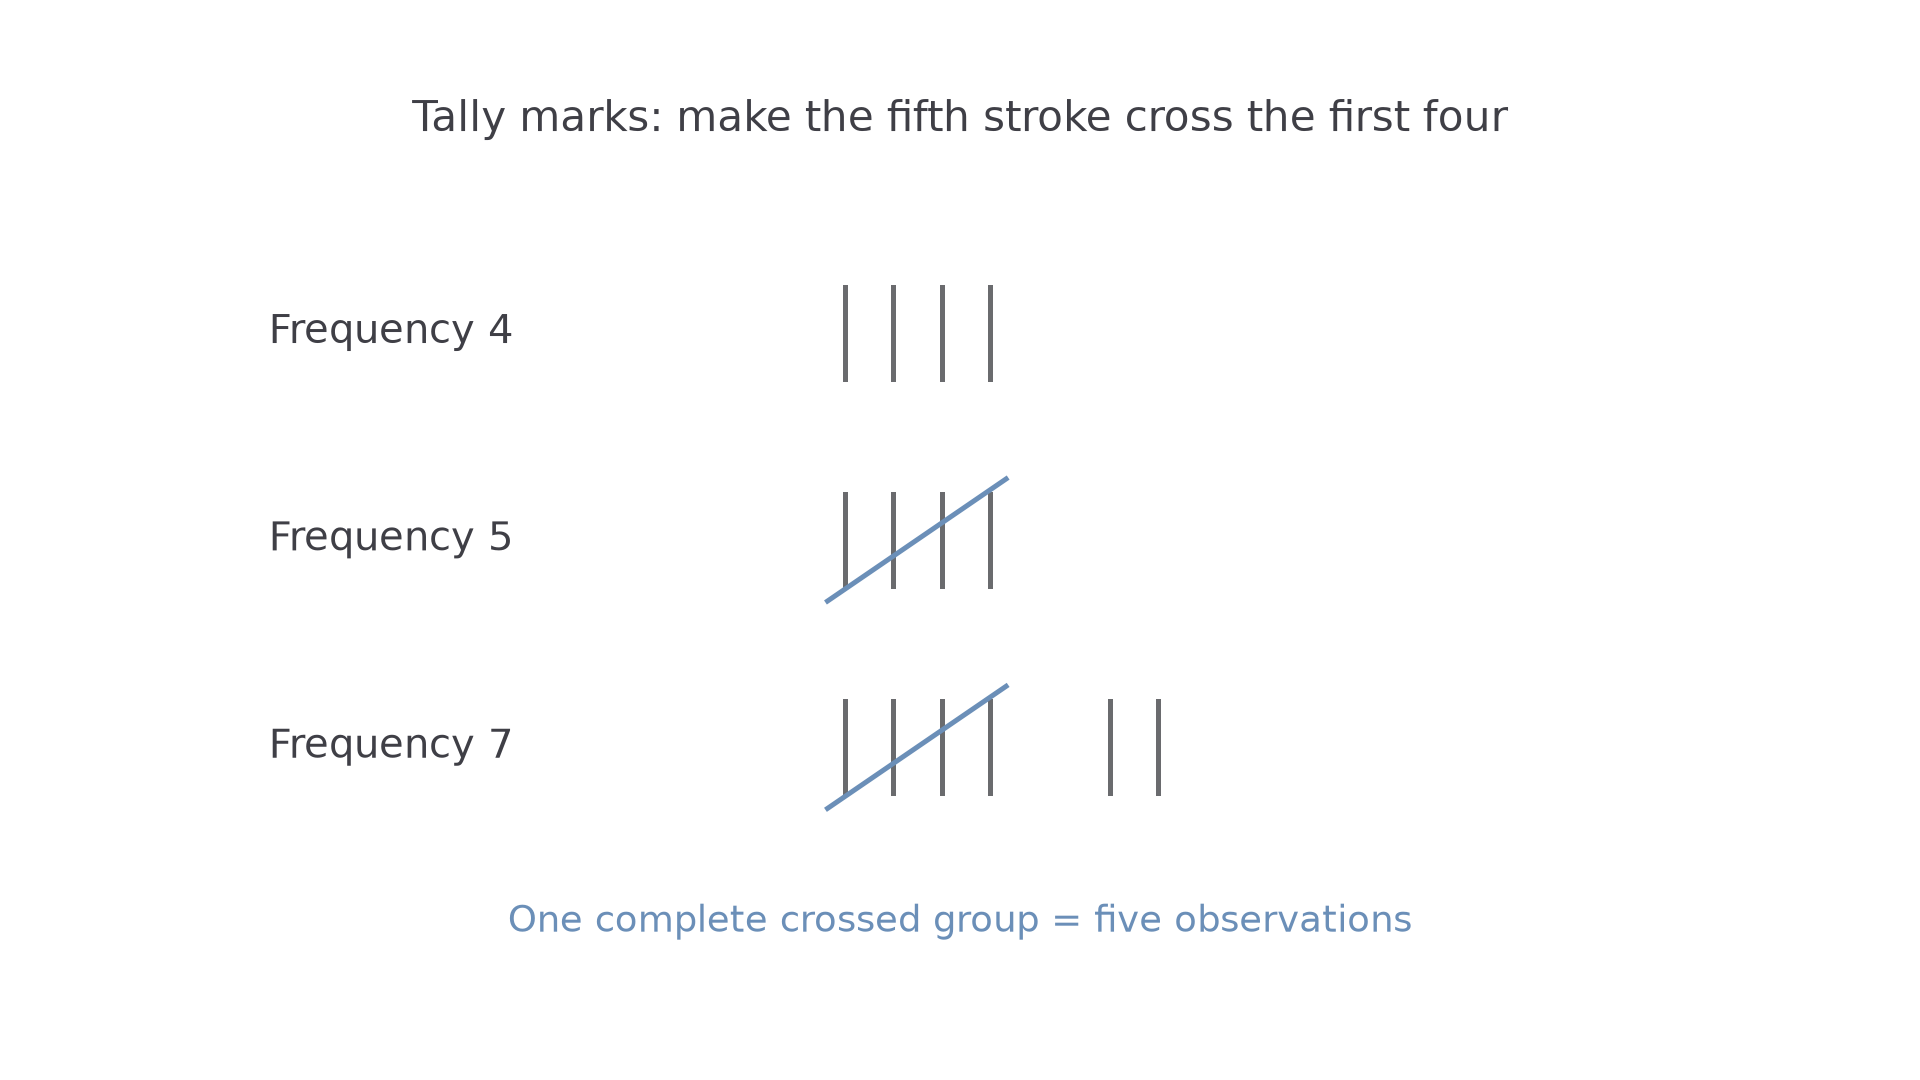
Read a raw list once, marking exactly one tally for each observation. Then count the tallies and add the frequencies. A correct total is an important check, although two misplaced observations could still cancel one another.
Worked example 1: organising a raw list
Question. These are the main travel methods of thirteen students. Make a frequency table.
Walk, Bus, Walk, Cycle, Bus, Walk, Walk, Cycle, Bus, Walk, Cycle, Walk, Bus.
Plan. Tally each method in its own row, then count the groups.
The walk row has a group of five and one more stroke; bus has four strokes; cycle has three.
| Main method | Frequency |
|---|---|
| Walk | |
| Bus | |
| Cycle | |
| Total |
Answer. The frequencies are , respectively.
Check. Numbering the original list gives thirteen entries, agreeing with the frequency total. Re-reading only the walk entries gives positions , confirming its frequency independently.
Keep the original observations, but add two late responses. An update changes only the affected rows.
Continue this lesson.
You’re previewing NovaLearn without an account. Create a free account to read the rest.
Create free account