C2.9; E2.9 - Travel and conversion graphs
A graph can tell a journey's story without a sentence. You will draw practical graphs from data, read their scales and interpret travel and conversion graphs for C2.9 and E2.9, using gradients as rates of change.
Reading practical graph axes and scales
Can a horizontal line represent someone travelling quickly? It depends on what the vertical axis measures. For travel along one straight road from home, a horizontal distance-from-home graph means stopped; on a graph of speed against time it means constant speed. The axis label and situation come before the shape.
A practical graph pairs two measured quantities. Read each quantity and its unit, the labelled values and the number of small intervals between them. The two axes need not use the same scale. Time might be elapsed minutes, or clock time: a change from 10:40 to 11:10 is 30 minutes, not 70.
Reading a scale
The value of one small interval is the difference between two labelled values divided by the number of equal intervals between them. To read a point, follow across and down to the axes; keep the units with the readings.
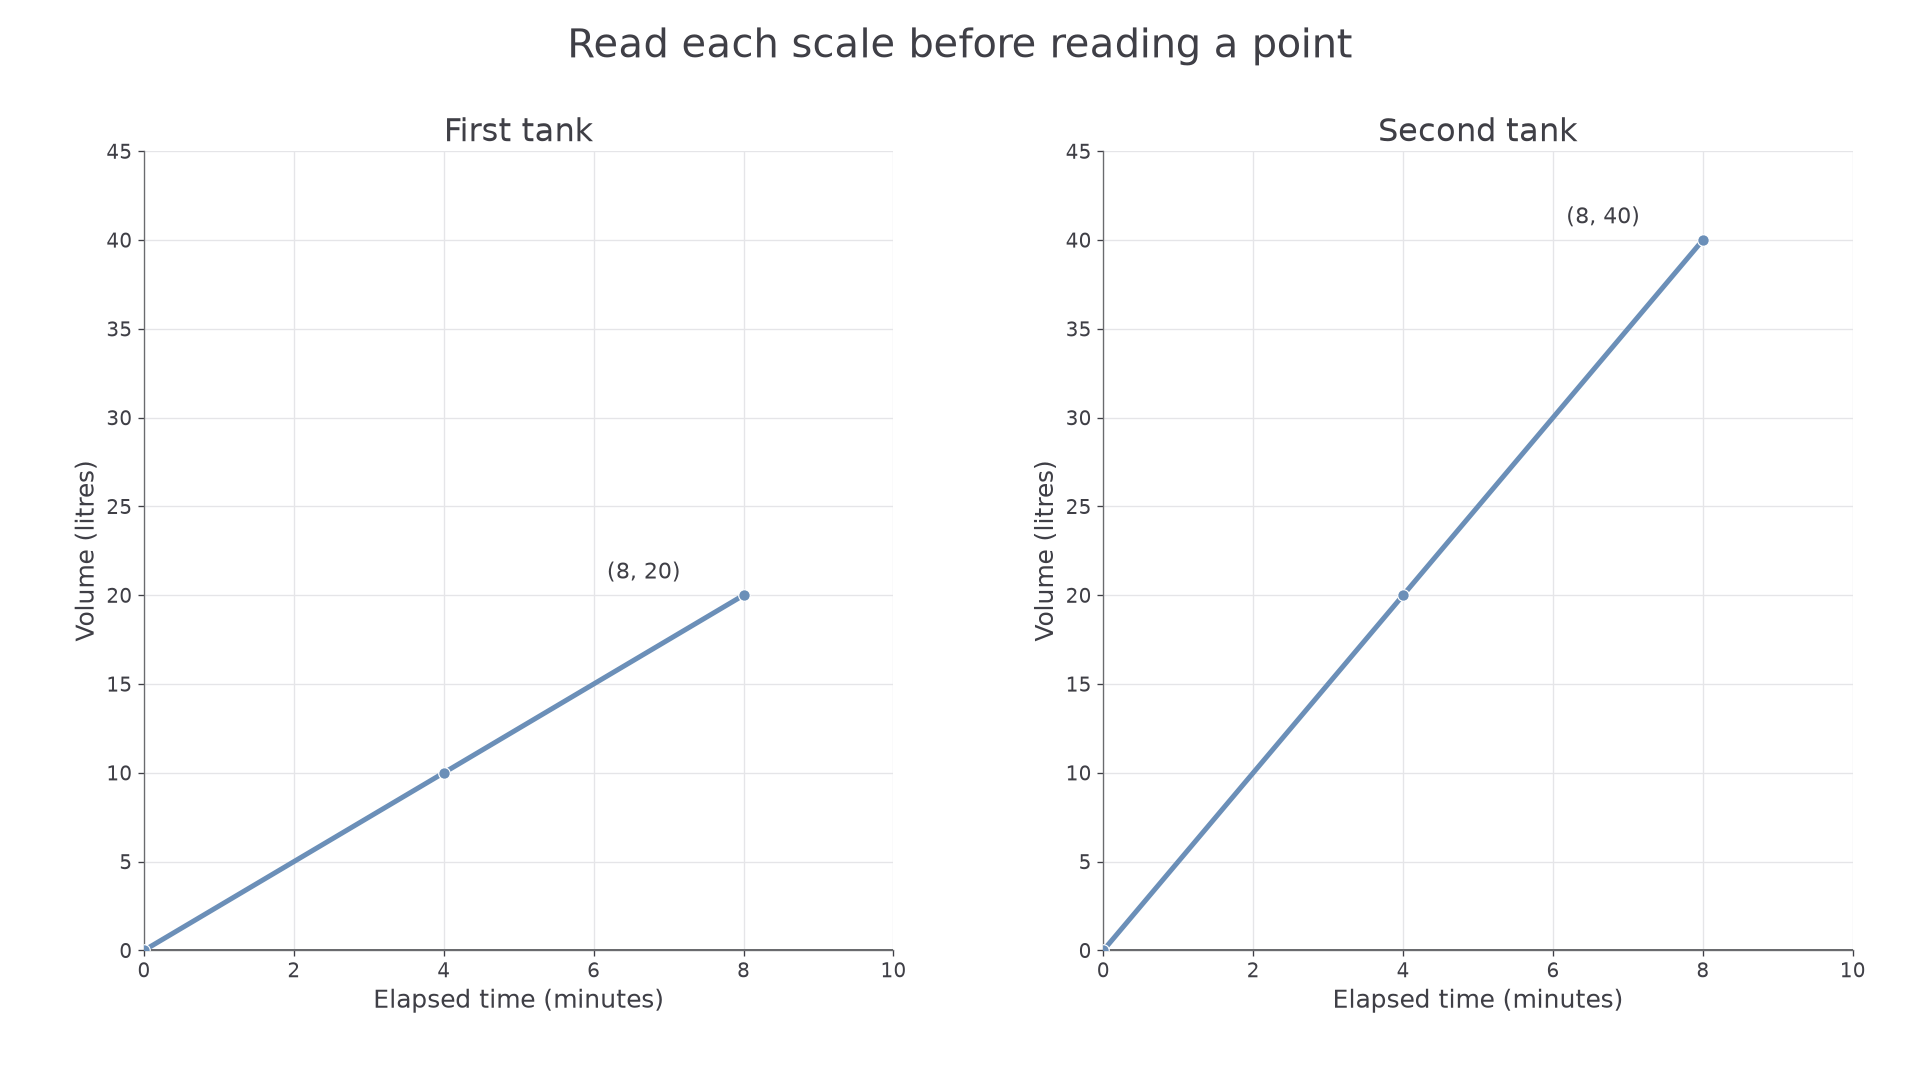
[DIAGRAM: asset_name: Practical axes with different scales; asset_slug: practical_scales; caption: Count intervals, then attach the axis units to each reading.; description: Two numbered grids plot volume in litres against elapsed time in minutes. Each horizontal interval is two minutes and each vertical interval is five litres. The first grid has points at four minutes ten litres and eight minutes twenty litres. The second has four minutes twenty litres and eight minutes forty litres, joined by a ruled line through the origin.]
Worked example 1: reading a measured point
Question. In the left graph, read the time and volume at the point four horizontal intervals right and four vertical intervals up from the origin.
Plan. Work out each interval's value before multiplying by the interval count.
Answer. After 8 minutes, the volume is 20 litres.
Check. Halfway along the same straight line is the marked point at 4 minutes and 10 litres, half of both readings.
Keep the time the same, but double the vertical coordinate. The axis scale stays fixed; the measured volume changes.
Worked example 2: drawing from data
Question. A second tank contains 0, 20 and 40 litres after 0, 4 and 8 minutes. Water enters at a constant rate. Draw its graph on the same scales.
Plan. Pair time with volume, plot each pair and rule a line because the rate is constant.
Answer. Plot the three points and rule the line segment from to , as in the right graph. Label time in minutes and volume in litres.
Check. Reading the line at 6 minutes gives 30 litres. This is halfway between the data at 4 and 8 minutes, consistent with constant filling.
Join data in the way the situation supports. A constant rate gives a straight section. Separate daily measurements do not by themselves prove that every intermediate change was constant. Reading between known points is interpolation; extending beyond them is extrapolation, which needs an assumption that the pattern continues.
Watch out
A point four squares across need not mean four minutes. Read the numbered scale, and do not treat the physical angle of a line as a rate when its axes have different units.
Distance-time journeys
A distance–time graph must tell you what “distance” means. Total distance travelled cannot decrease. Distance from a starting place can decrease when someone returns towards it. In the journey below, the vertical coordinate is distance from home along one straight road.
[DIAGRAM: asset_name: A journey away from and back towards home; asset_slug: journey_sections; caption: Rising means farther from home; level means stopped; falling means returning.; description: A numbered distance-from-home graph joins time and distance points zero zero, twenty minutes two kilometres, thirty minutes two kilometres and fifty minutes zero. The three straight sections are labelled outward, stop and return. Both axes and units are labelled.]
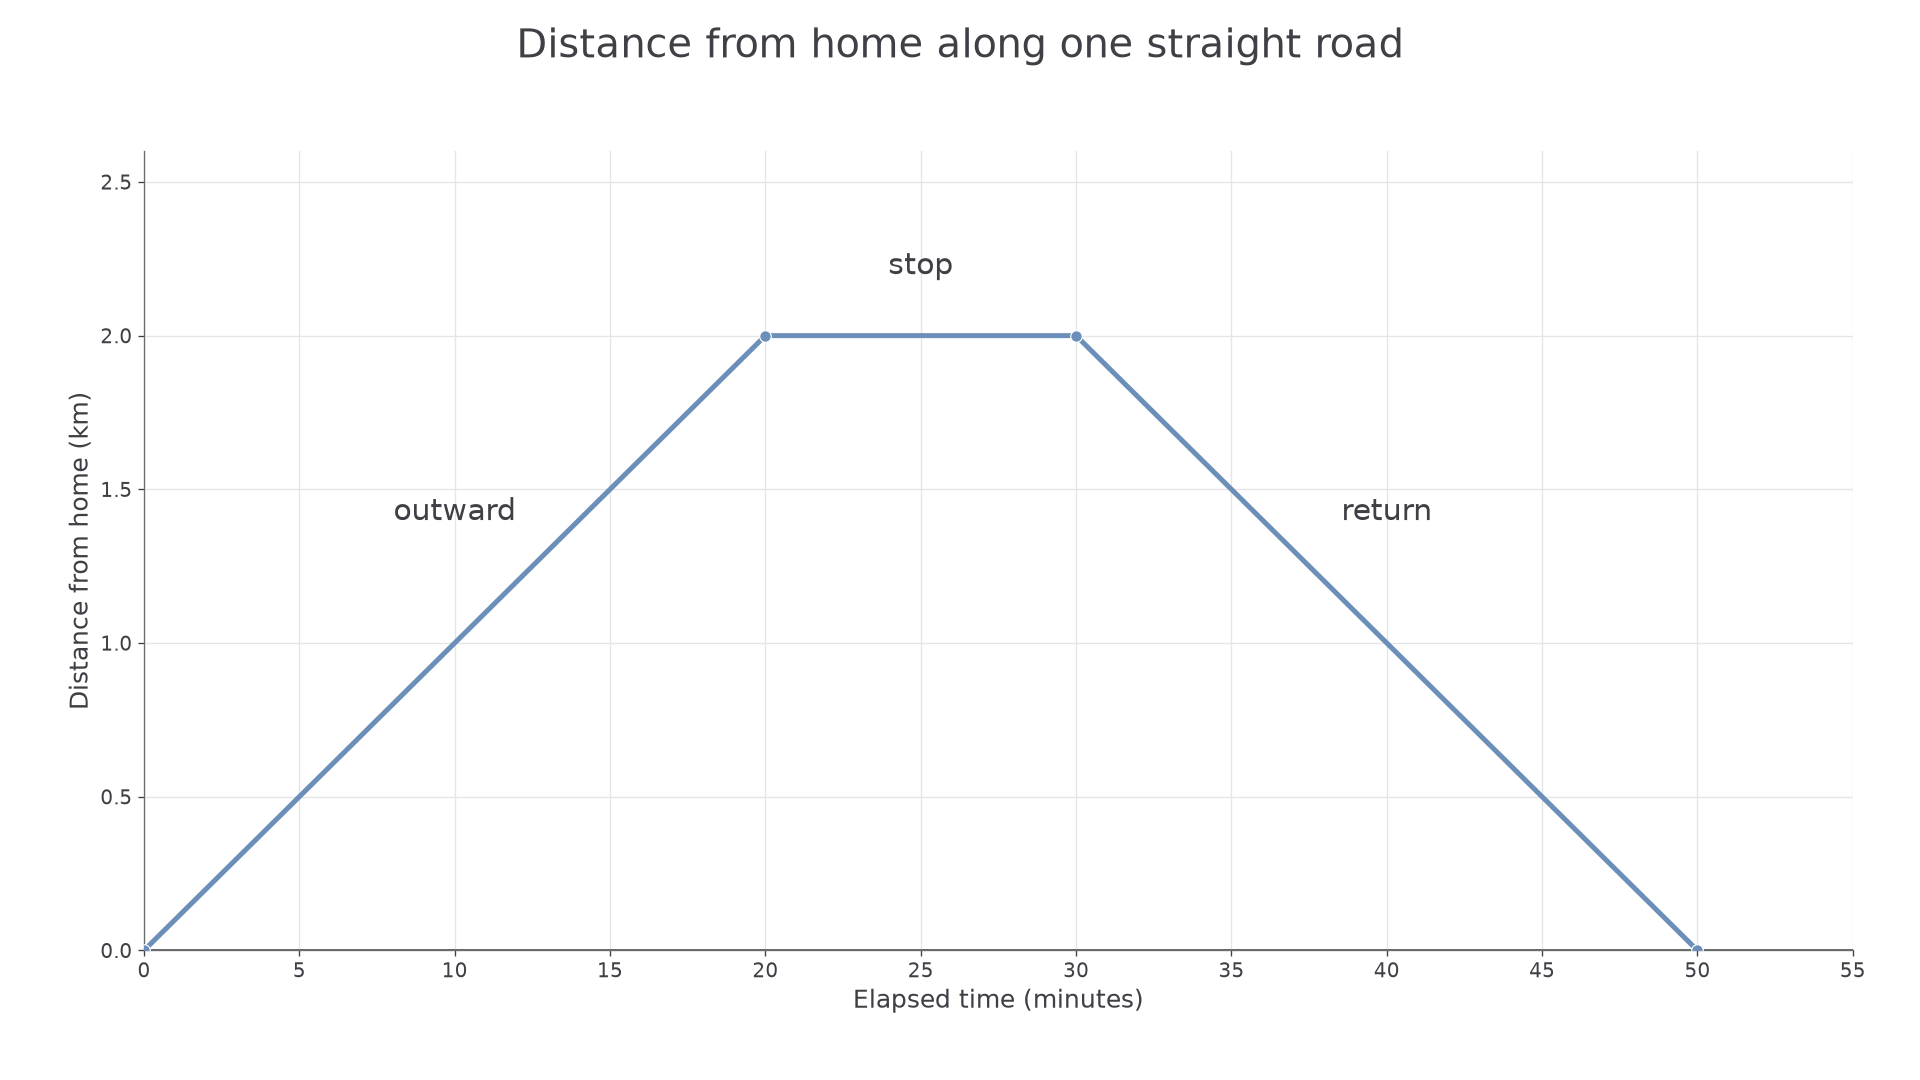
On a straight section, the speed is the size of the distance change divided by the elapsed time. A falling section has negative gradient because distance from home decreases; the person's speed is non-negative. Horizontal sections represent a stop here. A steeper section means greater speed when the axes and scales are the same.
Speed on a straight travel section
For motion along the road in one direction,
Use consistent units. For an entire journey, average speed is total distance travelled divided by total elapsed time, including stops. Not given in the List of formulas: learn it.
Worked example 3: the outward section
Question. Use the graph to calculate the outward speed in kilometres per hour and the stopping time.
Plan. Read the section's changes, convert its minutes to hours and read the level interval separately.
Answer. The outward speed is ; the stop lasts 10 minutes.
Check. At , travelling for one-third of an hour covers 2 km. No distance is added during the stop.
Continue this lesson.
You’re previewing NovaLearn without an account. Create a free account to read the rest.
Create free account