E9.2, E9.3 - Quartiles and interquartile range
The range can be dominated by a single unusual observation. You will find quartiles and the interquartile range, then compare the middle and spread of data using summaries less sensitive to extreme values.
Quartiles in an ordered list
Can changing only the largest observation leave a useful measure of spread unchanged? First locate the middle of each half of an ordered list, rather than using its two extremes.
You already know that the median splits ordered observations into a lower and an upper half. Find the median of each half to locate the quartiles. Keep repeated values: each observation occupies a position even when its value is repeated.
Quartiles
The lower quartile, , marks about a quarter of the way through ordered data. The upper quartile, , marks about three quarters of the way through. For individual lists in this lesson, take the median of the lower half and of the upper half. When the list has an odd number of observations, exclude its overall median from both halves.
This states the convention being used: different small-sample quartile conventions exist. Follow a convention specified in a question. Ties also mean that exactly one quarter of the observations need not be strictly below .
Worked example 1: an even number of observations
Question. Find the median and quartiles of
Plan. Split the eight ordered observations into two groups of four, then find their medians.
Answer. , median , .
Check. Pairing off the extremes of the lower half leaves four and five; doing the same in the upper half leaves eleven and twelve. Both quartiles lie on the correct side of the overall median.
Insert just one extra observation, eight. The overall median is now an actual observation, which we exclude before finding the two half-medians.
Worked example 2: an odd number of observations
Question. Find the median and quartiles of
Use the convention of excluding the overall median from the halves.
Plan. Locate the fifth observation, set it aside, then use the four observations on either side.
Answer. , median , , as before.
Check. The two halves contain four observations each; adding back the excluded median gives . No observation has been duplicated.
[DIAGRAM: asset_name: Quartiles in even and odd lists; asset_slug: quartile_halves; caption: The same lower and upper halves surround the median in these two lists.; description: Two rows of ordered data show the eight values two four five seven nine eleven twelve fourteen and the nine values formed by inserting eight in the middle. Pale blue rectangles identify the lower four and pale green rectangles identify the upper four in each row. The central eight in the second row is separately outlined and labelled excluded from the halves. Labels give Q1 four point five, median eight and Q3 eleven point five.]
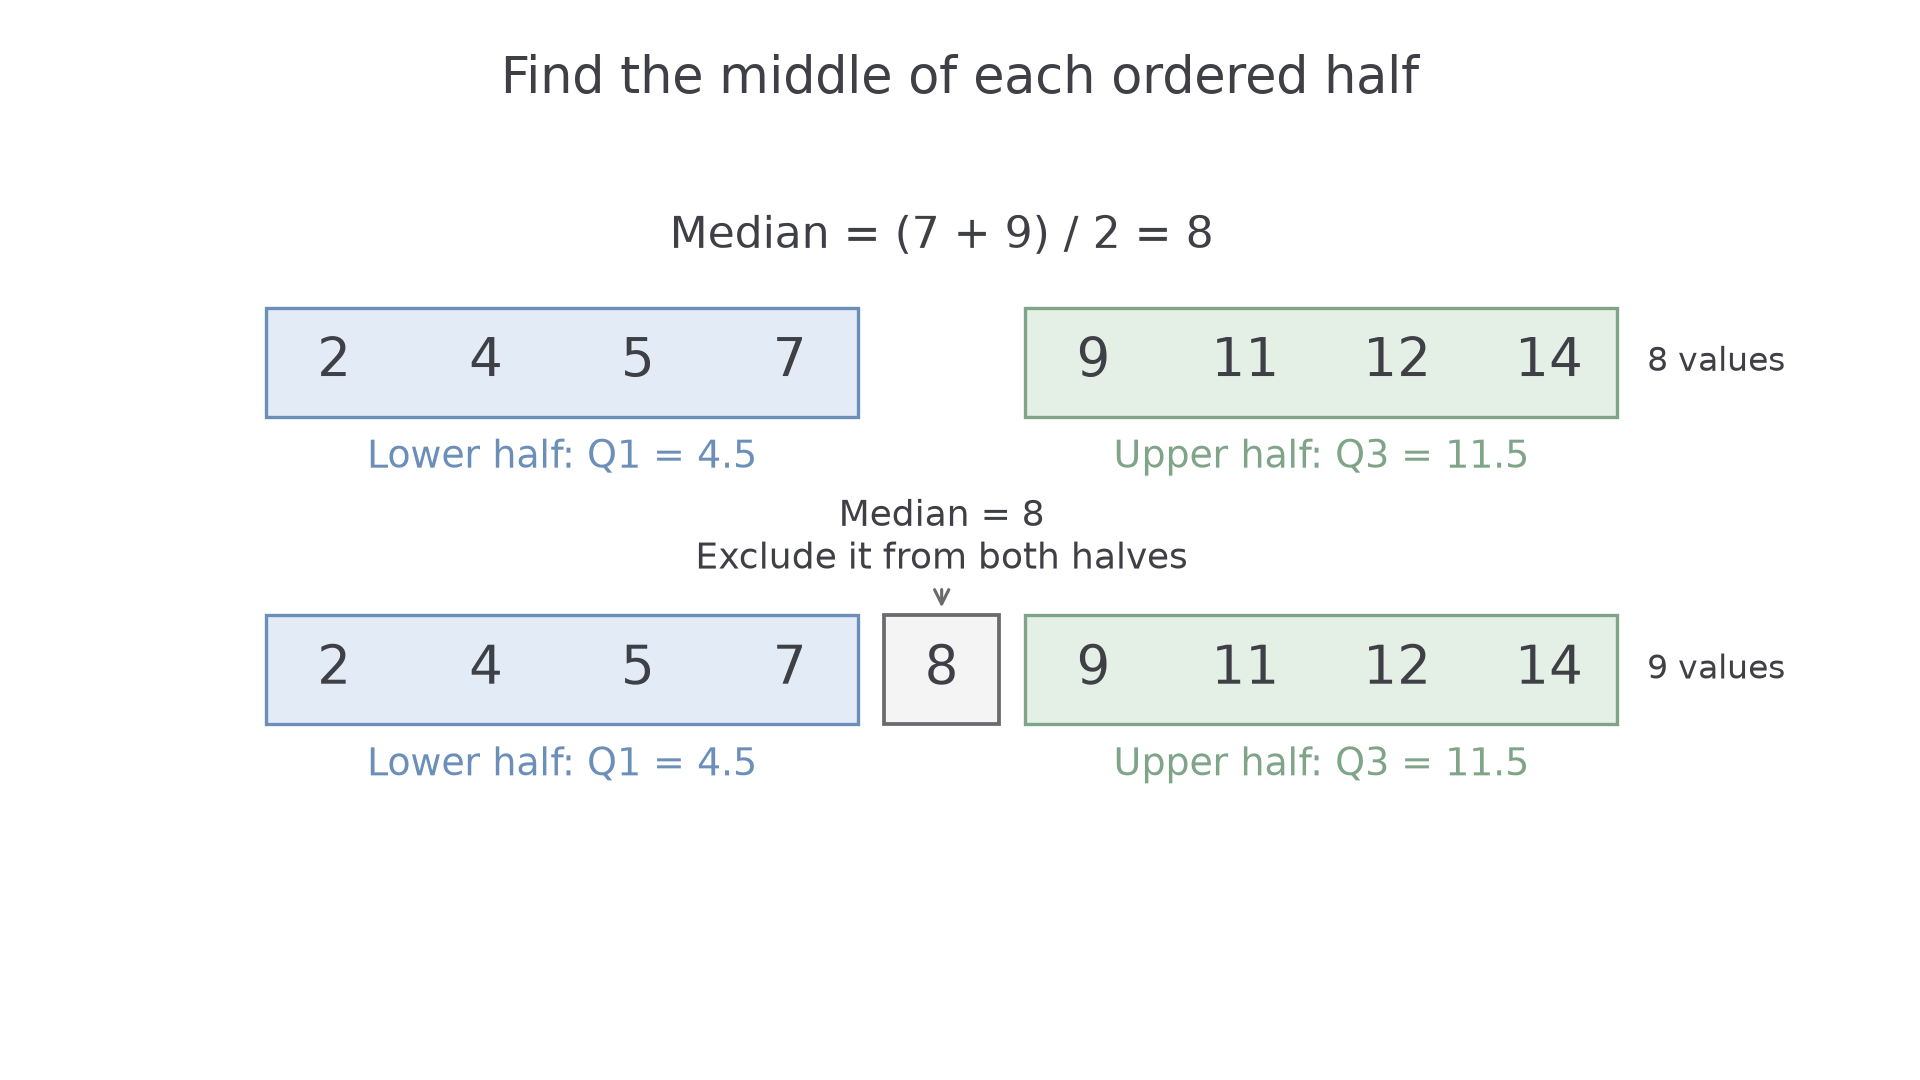
Both examples locate centres by position. Neither averages every observation: a middle value and an equal-share mean answer different questions.
Watch out
Quartile positions are counting instructions, not quartile values. Order the data and read the values at the required positions. For the stated odd-list convention, including the overall median in both halves changes the calculation.
Apply the same convention to a new list.
Interquartile range
The distance from to describes the spread of the middle part of the data. It leaves out the most extreme ends, which can make it a more stable description than the full range.
Interquartile range
The interquartile range, or IQR, has the same unit as the observations. It describes the width of the middle approximately of the ordered data. This formula is not given in the List of formulas: learn it.
An IQR cannot be negative because . It can be zero when the two quartiles coincide, including some data sets that contain different extreme values.
Worked example 3: comparing the two measures of spread
Question. The eight measurements centimetres have quartiles and centimetres. Find their IQR and range.
Plan. Use quartiles for the IQR and extreme observations for the full range.
Answer. IQR ; range .
Check. The interval from to lies inside the interval from to . Its width must therefore be no larger than the full range, as confirms.
Change only the largest measurement from fourteen to forty-four. Its magnitude changes, but it remains the largest observation.
Continue this lesson.
You’re previewing NovaLearn without an account. Create a free account to read the rest.
Create free account