C8.3; E8.3 - Sample spaces and combined events
Two results together can have more possibilities than the short list of their totals suggests. For Core and Extended, C8.3/E8.3 uses complete sample spaces and two-set Venn diagrams to calculate combined probabilities. You will keep ordered outcomes distinct, count events systematically and handle repeated selections with replacement.
Listing a complete sample space
Draw a numbered counter, return it, and draw again. Are the totals equally likely when the counters are ? A total of four can be made in several ways. Listing the underlying outcomes will reveal the different chances.
A sample space is a complete list of possible outcomes of an experiment. For two stages, record both results in order. A grid is useful: one stage labels rows, the other labels columns, and every cell combines one of each. It prevents omissions and repeated outcomes.
Worked example 1: two different devices
Question. A fair coin is tossed and, independently, a fair spinner with three equal sectors labelled is spun. List the complete sample space.
Plan. Use a row for each coin result and a column for each spinner result.
| Spinner | Spinner | Spinner | |
|---|---|---|---|
| Head | |||
| Tail |
Answer. .
Check. Each of the two coin results appears once with each of the three spinner results. Every possible combination occurs once, so the list is complete.
The independence condition here means the coin result does not alter the spinner's chances. Together with fair devices, it makes the six cells equally likely. A complete grid alone does not guarantee equal chances.
Change only the number of equal sectors on the spinner. The same listing method needs one extra column.
Worked example 2: one extra possible result
Question. The fair coin is now paired independently with a fair spinner having four equal sectors labelled . List the complete sample space.
Plan. Pair each coin result with all four spinner results.
| Spinner | Spinner | Spinner | Spinner | |
|---|---|---|---|---|
| Head | ||||
| Tail |
Answer. .
Check. Removing the two cells involving returns the previous six-outcome list; every other pairing is unchanged.
For two rolls of a die, and are different outcomes: the first and second rolls have exchanged results. Even if the question eventually adds the numbers, retain that order while listing the underlying chances.
Watch out
A list such as mixes the individual devices' results. One complete outcome must state both results, such as .
Keep the two stages visible when listing the new combinations.
Counting combined events
Now consider three counters labelled , with each counter equally likely to be drawn. After the first draw, replace the counter and mix thoroughly before the second draw. With replacement means returning the selected object before drawing again. The same three counters are available each time, and the mixing makes each second-draw counter equally likely regardless of the first result.
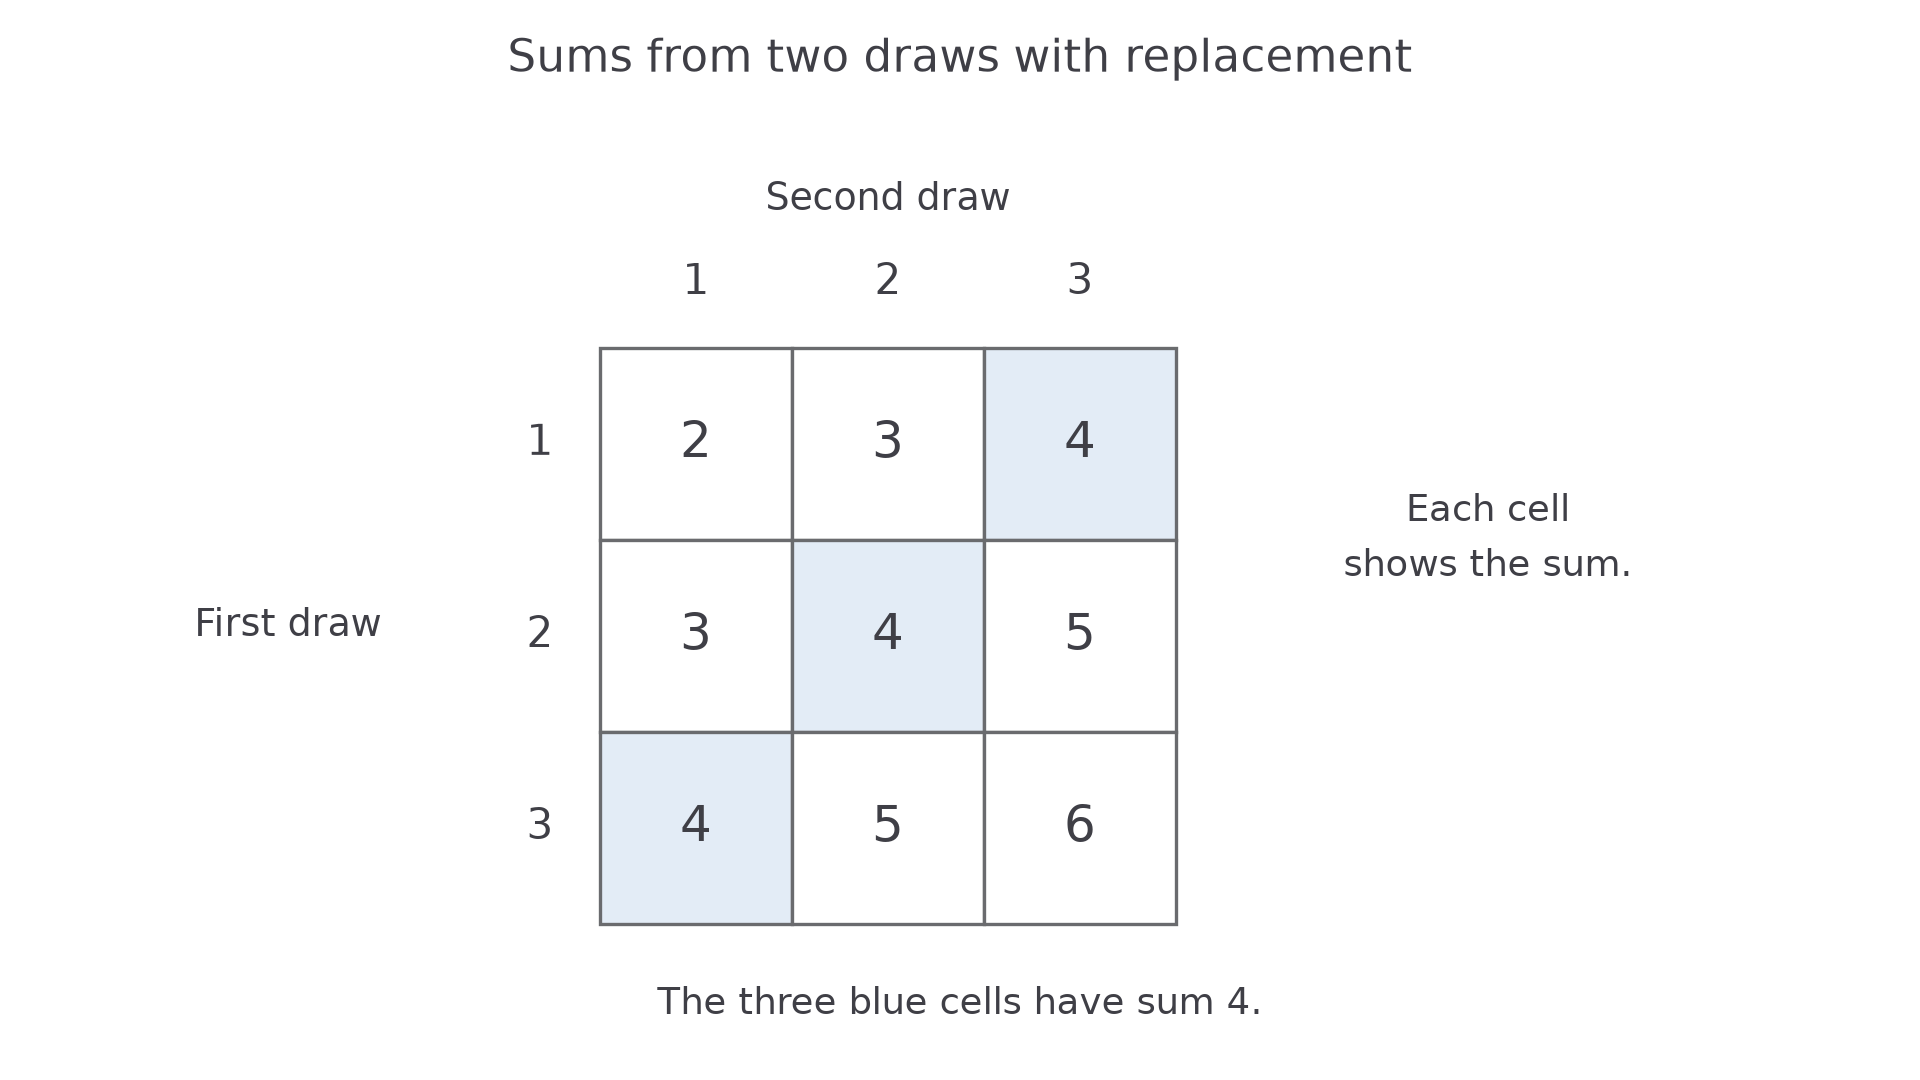
The nine ordered pairs are therefore equally likely. Their sums need not be. The grid displays the sum in each cell, rather than using one cell for each different sum.
[DIAGRAM: asset_name: Sums from two draws with replacement; asset_slug: sample_space_counter_sums; caption: Nine equally likely ordered pairs produce five totals with unequal frequencies.; description: A three-by-three sample-space grid has first-draw row labels 1, 2 and 3 and second-draw column labels 1, 2 and 3. Cell sums are 2, 3, 4 in the first row; 3, 4, 5 in the second; and 4, 5, 6 in the third. The three cells summing to 4 are shaded blue.]
Worked example 3: counting a repeated total
Question. Find the probability that the two draws described above have sum .
Plan. Count the ordered pairs making four among all nine equally likely pairs.
Answer. .
Check. The five total frequencies are for totals ; these add to , and the middle frequency is .
Continue this lesson.
You’re previewing NovaLearn without an account. Create a free account to read the rest.
Create free account