E2.9 - Speed, acceleration and distance
Speed–time graphs show how motion changes, while their areas measure how far something travels. You will interpret acceleration, calculate distance under straight sections and estimate a local rate using a tangent for E2.9.
Speed-time graphs and acceleration
Two vehicles can cover the same distance while their graphs look quite different. How can a picture of speed tell you both the change in motion and the distance travelled? First read the slope; the next part will explain the area.
On a speed–time graph, speed is vertical and time horizontal. We consider motion along a straight line without a reversal of direction, so a change in speed describes acceleration along that direction. A horizontal line above zero means moving at constant speed. A line on the time axis means stopped. A rising straight line means speed increases by equal amounts in equal times: constant acceleration.
Acceleration from a speed–time graph
For a straight section,
Speed in and time in seconds give acceleration in . A negative gradient means decreasing speed; its positive size is the deceleration. Not given in the List of formulas: learn it.
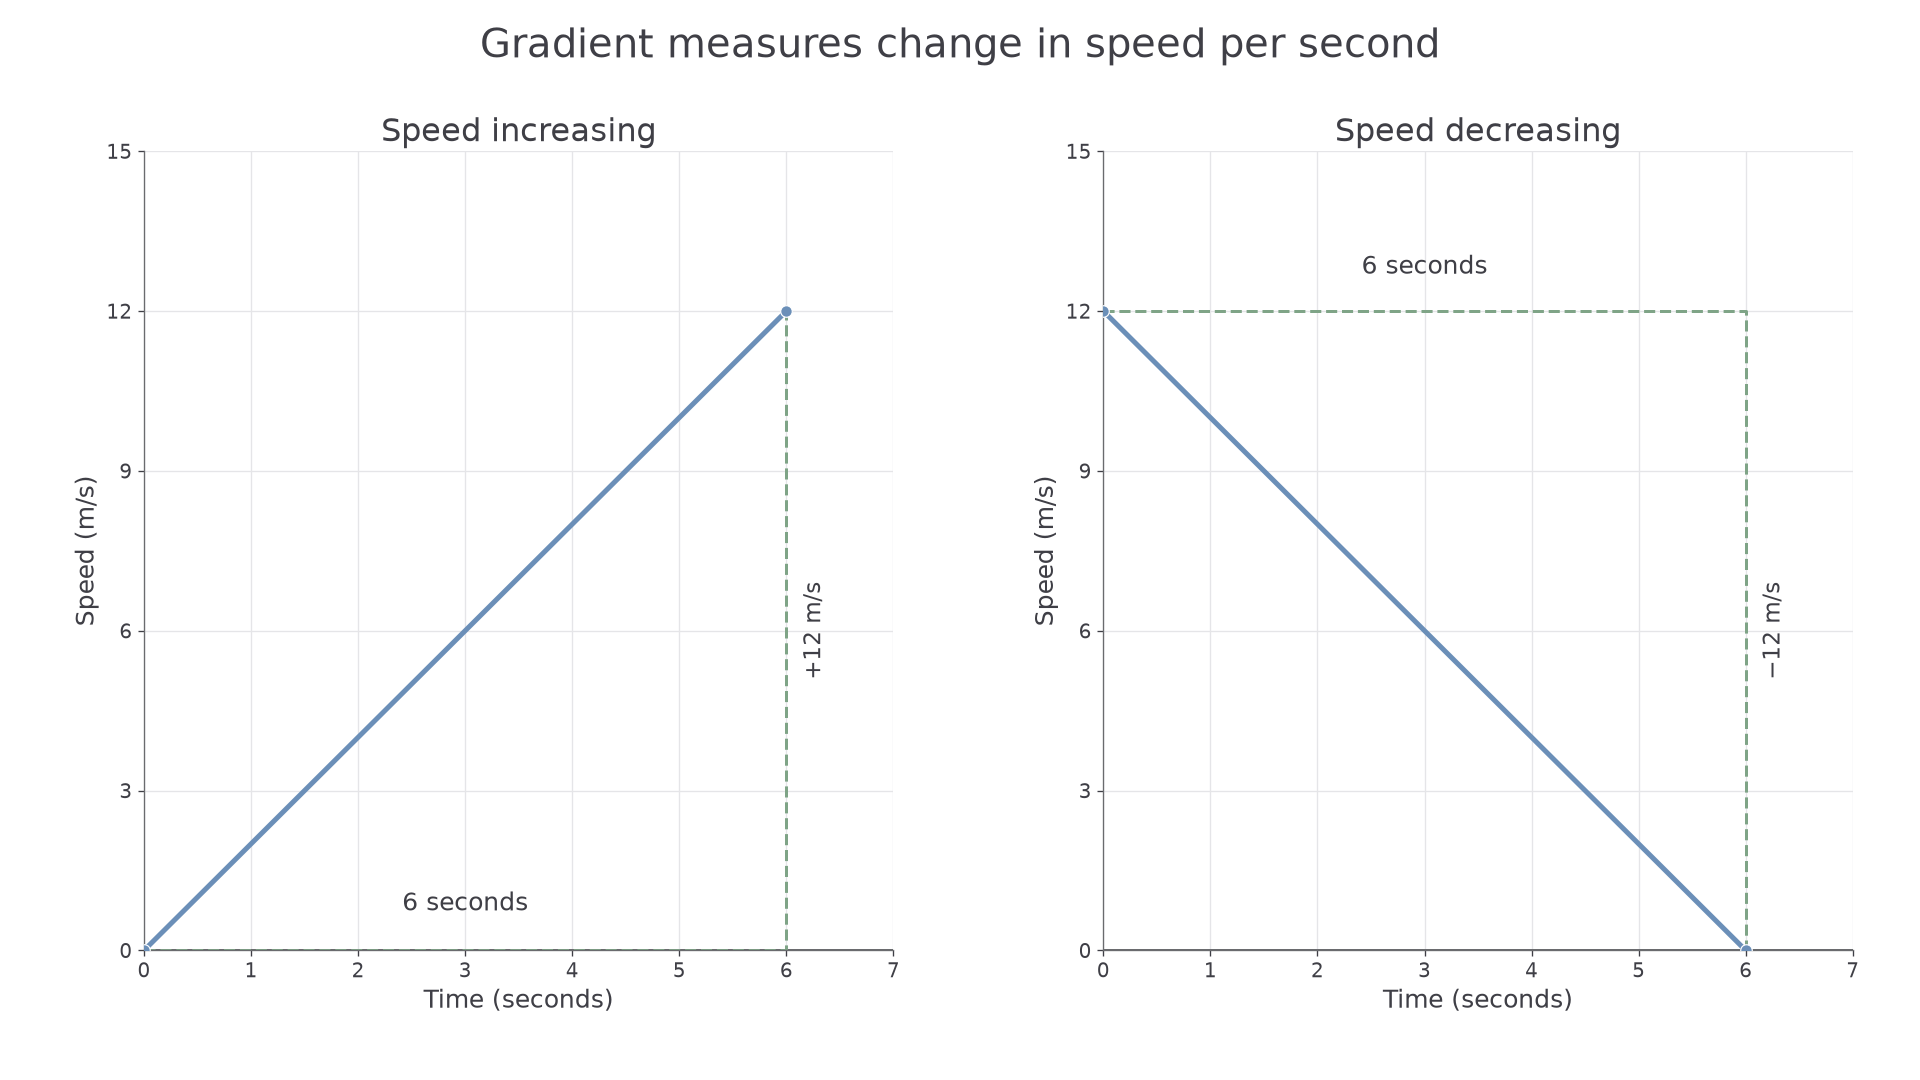
[DIAGRAM: asset_name: Increasing and decreasing speed; asset_slug: speed_gradients; caption: Equal changes in speed over equal times give equal gradient sizes with opposite signs.; description: Two numbered speed-time grids with speed in metres per second and time in seconds. The first joins zero seconds zero speed to six seconds twelve. The second joins zero seconds twelve to six seconds zero. Dashed rise-and-run triangles show a time interval of six seconds and speed changes of twelve and negative twelve.]
Worked example 1: gaining speed
Question. Calculate the acceleration in the left graph.
Plan. Divide the increase in speed by the elapsed time.
Answer. The acceleration is : speed increases by each second.
Check. Six increases of give the total increase of .
Reverse only the direction of the speed change. The time interval and gradient size stay the same.
Worked example 2: losing speed
Question. Calculate the signed gradient and the deceleration in the right graph.
Plan. Keep final minus initial in the gradient calculation; give the size when naming deceleration.
Answer. Signed gradient ; deceleration .
Check. Starting at 12 and losing 2 each second gives speeds 10, 8, 6, 4, 2, 0, matching the endpoint.
These are graphs of speed, so the displayed speeds are non-negative. A negative slope is possible without a negative speed. A curve indicates that the rate of change of speed varies; one endpoint-to-endpoint gradient then gives an average change per second, rather than the rate at each instant.
Watch out
A downward speed–time line means slowing down. A downward distance-from-home line means returning towards home. Read the vertical quantity before interpreting the slope.
Distance as an area
At constant speed, distance equals speed multiplied by time. On a speed–time graph, that product is the area of a rectangle: horizontal time multiplied by vertical speed. Its units are , so the numerical area represents a distance, not square metres.
For a straight sloping section, the speed changes uniformly. Pairing equally spaced speeds from opposite ends gives the same total each time, so the average speed is the mean of the two end speeds. Multiplying that mean by the duration gives the trapezium area. A triangle is the case with one end speed zero.
Distance under a speed–time graph
The distance travelled is the area between the speed–time graph and the time axis. For a straight section lasting , with end speeds ,
Use rectangles, triangles or trapeziums for straight sections. The List of formulas includes triangle area. Trapezium area and the speed–time interpretation must be learnt.
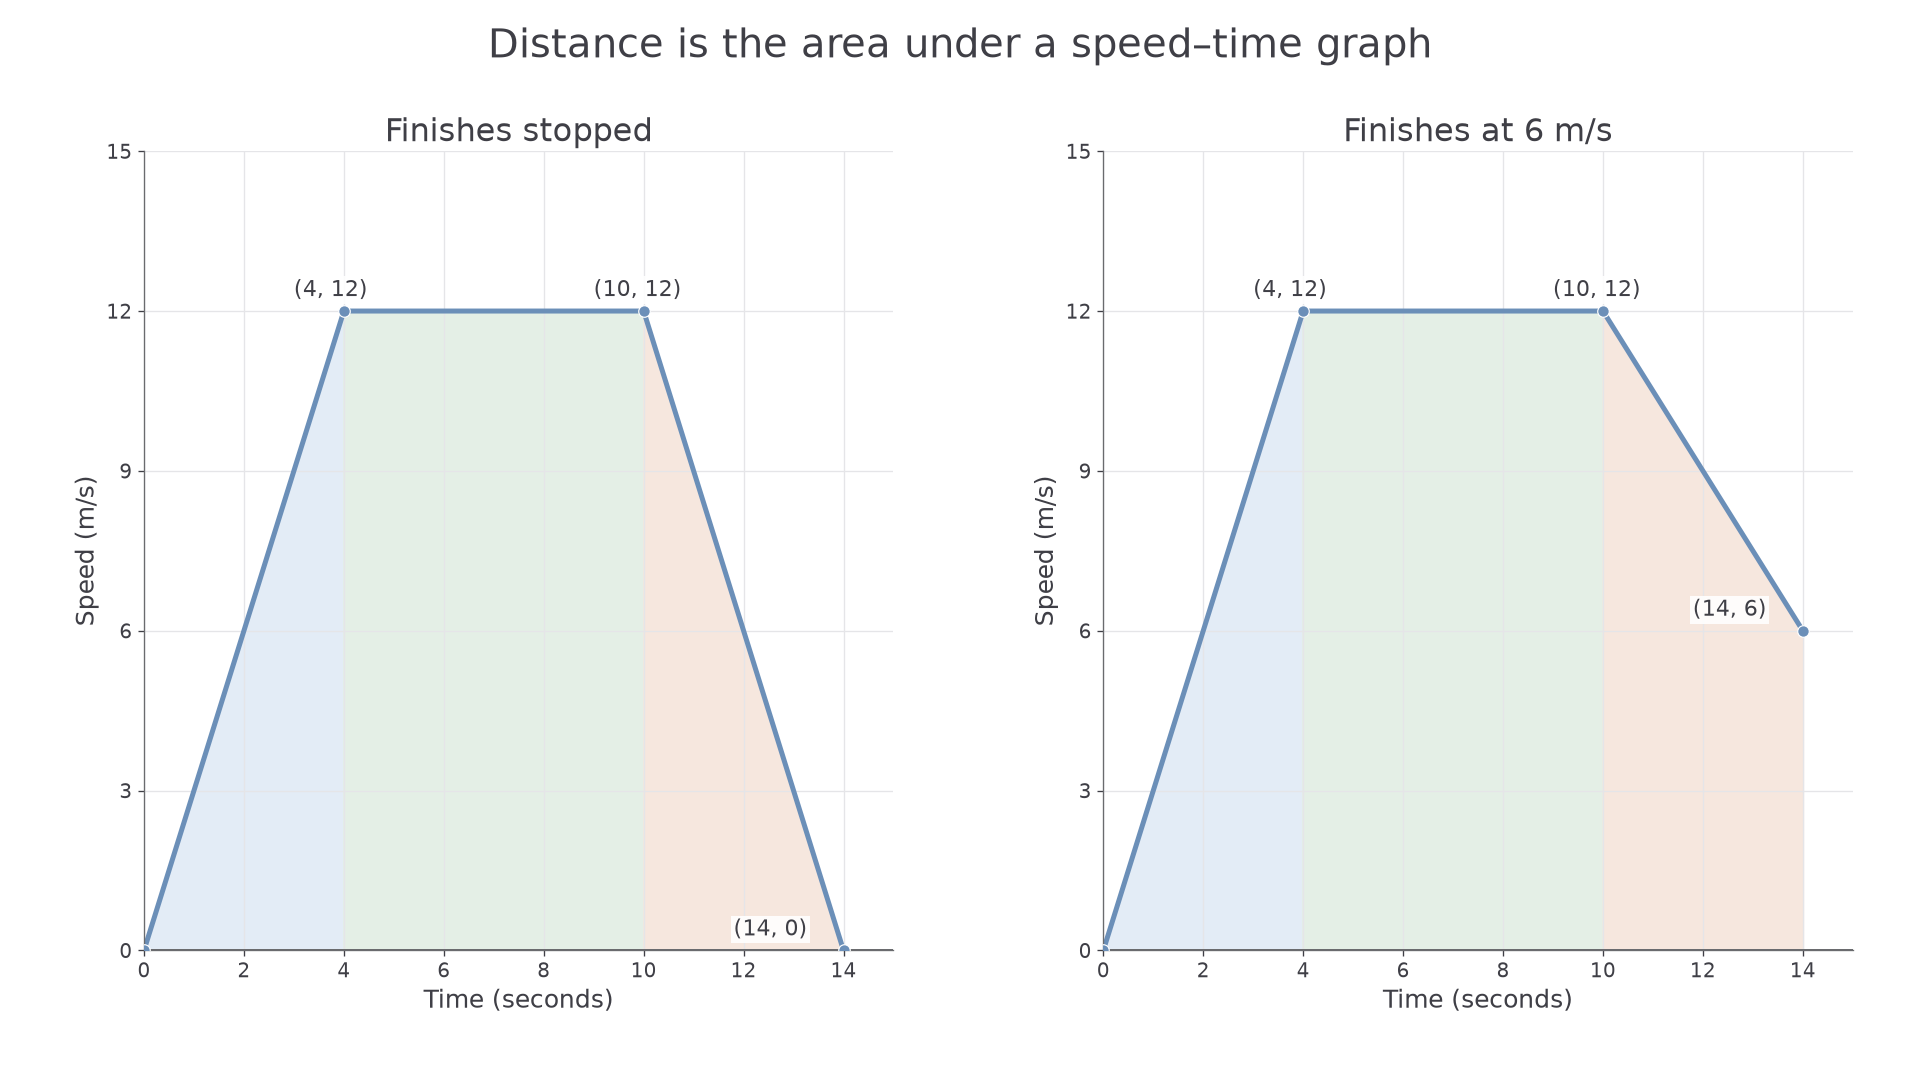
[DIAGRAM: asset_name: Distance from straight speed sections; asset_slug: speed_areas; caption: Split the area at each change of slope.; description: Two numbered speed-time grids show points at times zero, four, ten and fourteen seconds. Speeds on the first are zero, twelve, twelve and zero metres per second. Speeds on the second are zero, twelve, twelve and six. Pale shading splits the first into triangle rectangle triangle and the second into triangle rectangle trapezium.]
Worked example 3: accelerating, cruising, stopping
Question. Calculate the distance travelled in the left graph.
Plan. Add the areas of its two triangles and central rectangle.
Answer. 120 m.
Check. During each four-second ramp, average speed is 6 m/s, giving 24 m. The six-second cruise adds 72 m, confirming the total by speed multiplied by time on each section.
Continue this lesson.
You’re previewing NovaLearn without an account. Create a free account to read the rest.
Create free account