C3.2, C3.3; E3.2, E3.3 - Drawing lines and finding gradients
A straight-line equation describes a whole set of points. You will make tables and draw linear graphs for C3.2 and E3.2, then measure their gradients from a grid for C3.3 and E3.3, including horizontal and vertical lines.
Tables and plotting a straight line
How can a few plotted points reveal a line containing infinitely many points? Try the rule . For every chosen , the rule gives exactly one . Increasing by one increases by two, wherever you start. That constant change makes the points line up.
Linear graph
A linear graph is a straight-line graph. A point lies on the graph of an equation when its coordinates make that equation true. For example, lies on , because .
Use a table of values to organise the coordinate pairs. Label both axes, choose even scales that fit the values, plot the points carefully and use a ruler to draw one straight line through them. Extend the line over the requested range. Two distinct points fix a straight line; a third provides a useful check for a plotting or arithmetic error. Do not bend a line to include an incorrect point.
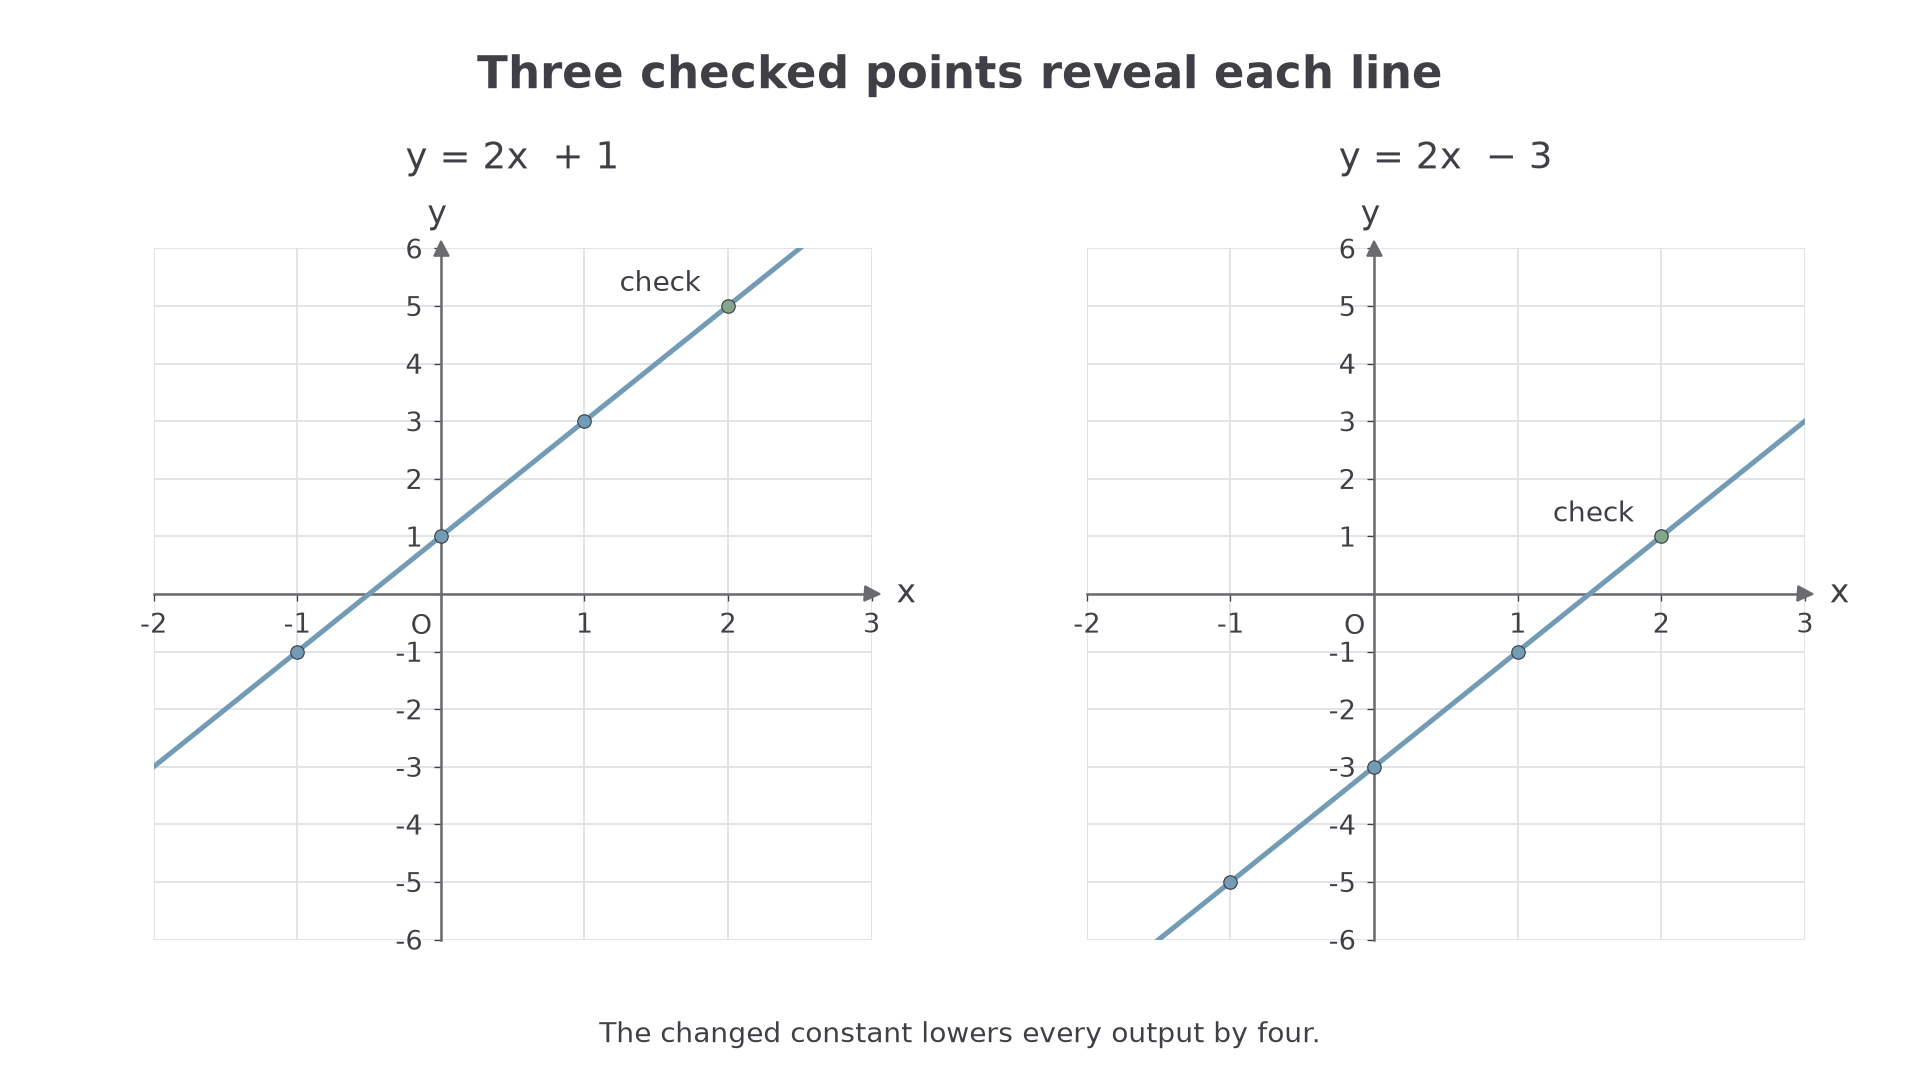
[DIAGRAM: asset_name: Tables become straight lines; asset_slug: plotting_lines; caption: Changing the added number moves the line but keeps its slope.; description: Two labelled Cartesian grids show three plotted points joined by a ruled line. The left graph is y equals two x plus one through negative one comma negative one, zero comma one and one comma three. The right is y equals two x minus three through negative one comma negative five, zero comma negative three and one comma negative one.]
Worked example 1: a table for a rising line
Question. Complete a table for at , and describe how to draw its graph.
Plan. Substitute each input, then plot the resulting ordered pairs.
Answer. Plot , and , then rule and extend the straight line through them, as in the left grid.
Check. A fresh input gives . The extended line passes through .
Change only the added constant from to . Every output falls by four; the input values and plotting process stay the same.
Worked example 2: a lower line
Question. Complete a table for at , and describe how to draw its graph.
Plan. Recalculate each output using the new constant.
Answer. Plot , and ; rule and extend the line through them, as in the right grid.
Check. At the additional input , the rule gives . That point is on the drawn line. The outputs are all four below the first table, as expected.
Watch out
The pair means , , not the other way round. Also, join the points with one ruled line rather than stopping after a short segment between two dots.
An equation may be presented in another arrangement when its table is supplied. In that case, use the given coordinate pairs to draw the graph; the meaning of plotting is unchanged.
Gradient as rise divided by run
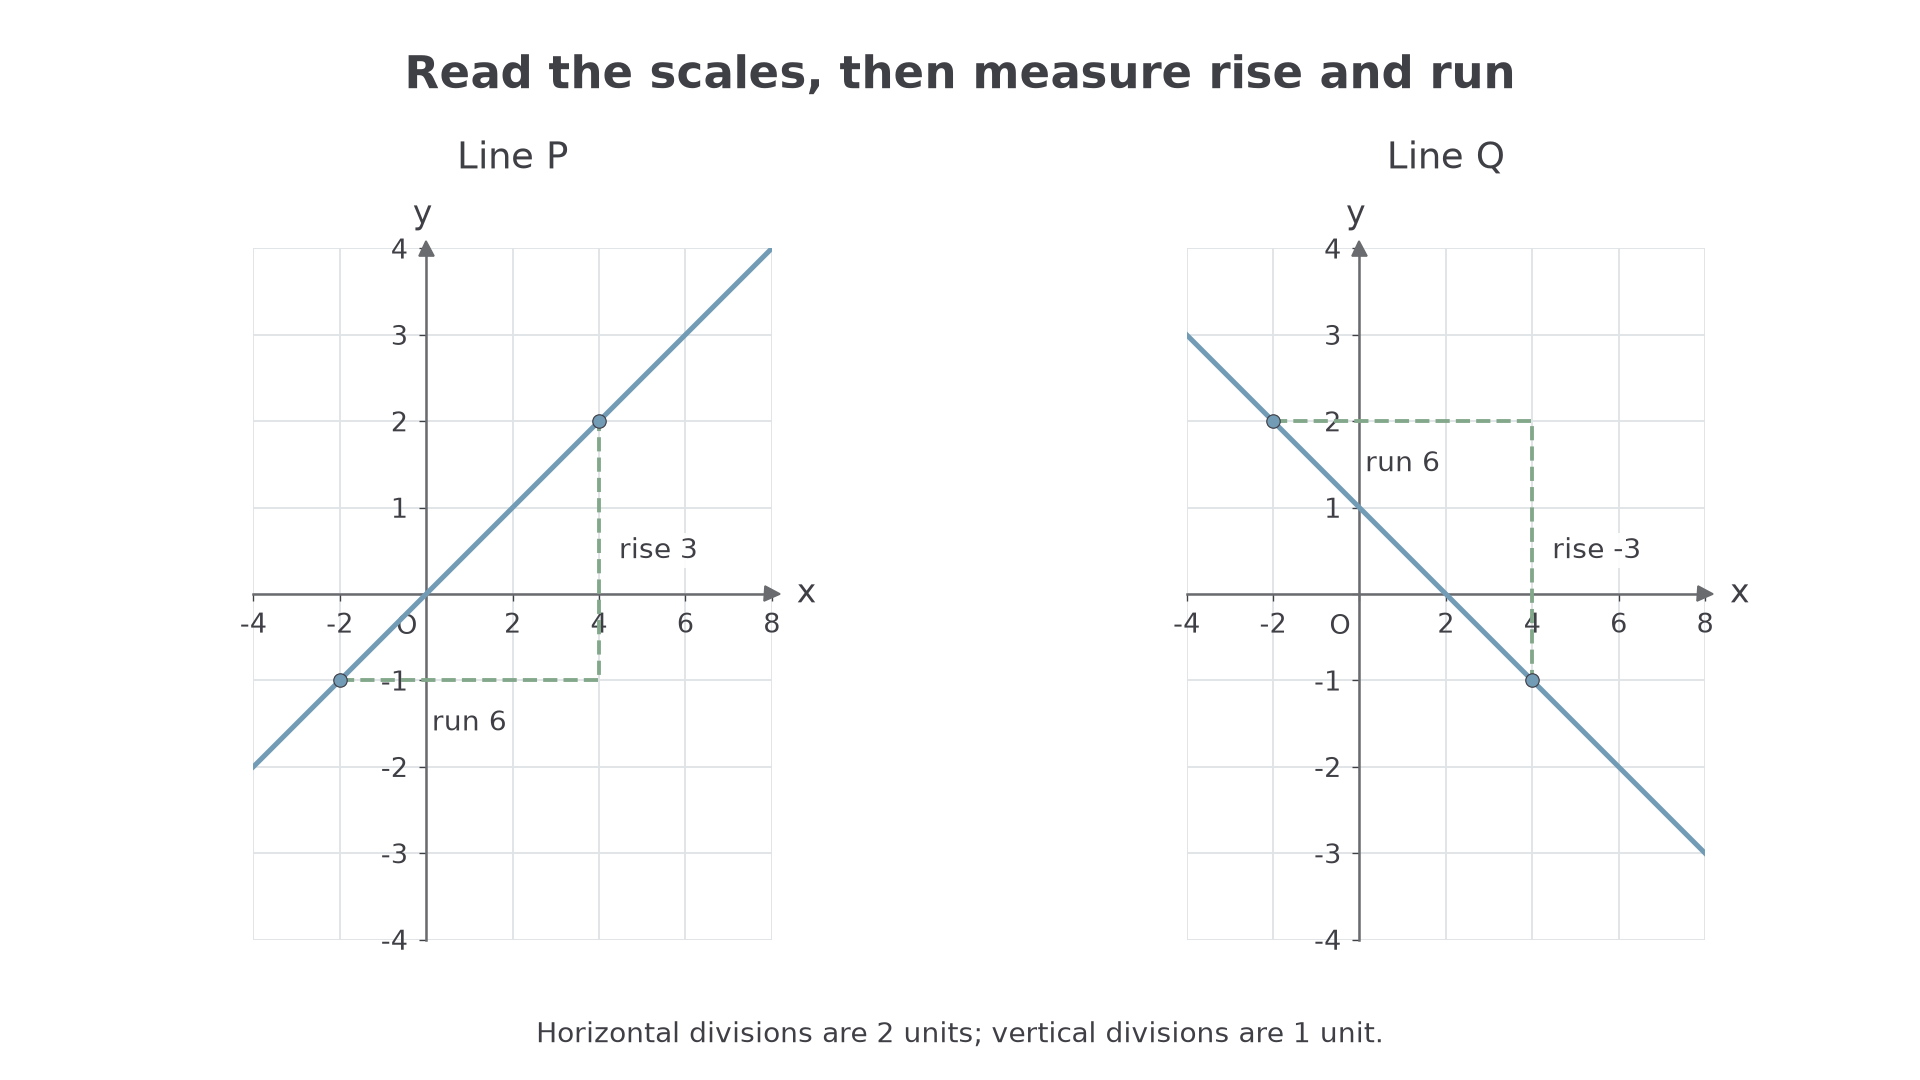
The gradient measures a line's change in vertical coordinate for each unit increase in horizontal coordinate. On a drawn grid, choose two clear points well apart, then draw a right-angled triangle with a horizontal run and a vertical rise. Read changes in coordinate units, not merely numbers of squares.
Gradient from a grid
For a non-vertical straight line, moving from left to right,
An upward change is positive; a downward change is negative. The horizontal change must be non-zero. Not given in the List of formulas: learn it.
Why can you choose a different-sized triangle? All such right-angled triangles on the same straight line have the same shape: multiplying the run also multiplies the rise by the same factor. Their ratio stays fixed. A long run usually makes a measured gradient more reliable than a tiny triangle.
[DIAGRAM: asset_name: Reading signed rise and run; asset_slug: gradient_triangles; caption: Read each axis scale before dividing the vertical change by the horizontal change.; description: Two numbered grids have horizontal divisions of two coordinate units and vertical divisions of one. Line P rises from negative two comma negative one to four comma two, with a triangle showing run six and rise three. Line Q falls from negative two comma two to four comma negative one, showing run six and rise negative three.]
Continue this lesson.
You’re previewing NovaLearn without an account. Create a free account to read the rest.
Create free account